
Trend Trading
In this lesson we will cover:
– Why most traders are trend traders
– How to identify the current trend
– How to draw trend lines on a chart
Financial markets are typically in one of three basic states at any one time: an uptrend, a downtrend or ranging. The majority of retail traders are trend traders, although some traders also use counter-trend and ranging market strategies as well.
Trend trading is the most popular trading method because markets move in a direction for longer and further, allowing traders to set their profit targets higher than their stop losses, thus giving them a potential edge, even if the majority of their trades are losing ones.
Correctly identifying the current state of a market is key to profitable trading.
Uptrends & Downtrends
If an instrument is trending, you should consider only taking a position and trading in the direction of the trend. Ideally you want to get into the position (long or short) at the best price possible, to maximise your potential profit.
Some traders may wait for a pullback (a reversal of the trend caused by large institutional market participants employing counter-trend strategies or taking profits). before entering the market, but you should be aware that no-one knows for sure how long a trend will last, and eventually, a pullback will turn into a reversal of a trend or a consolidation of price where markets start ranging.
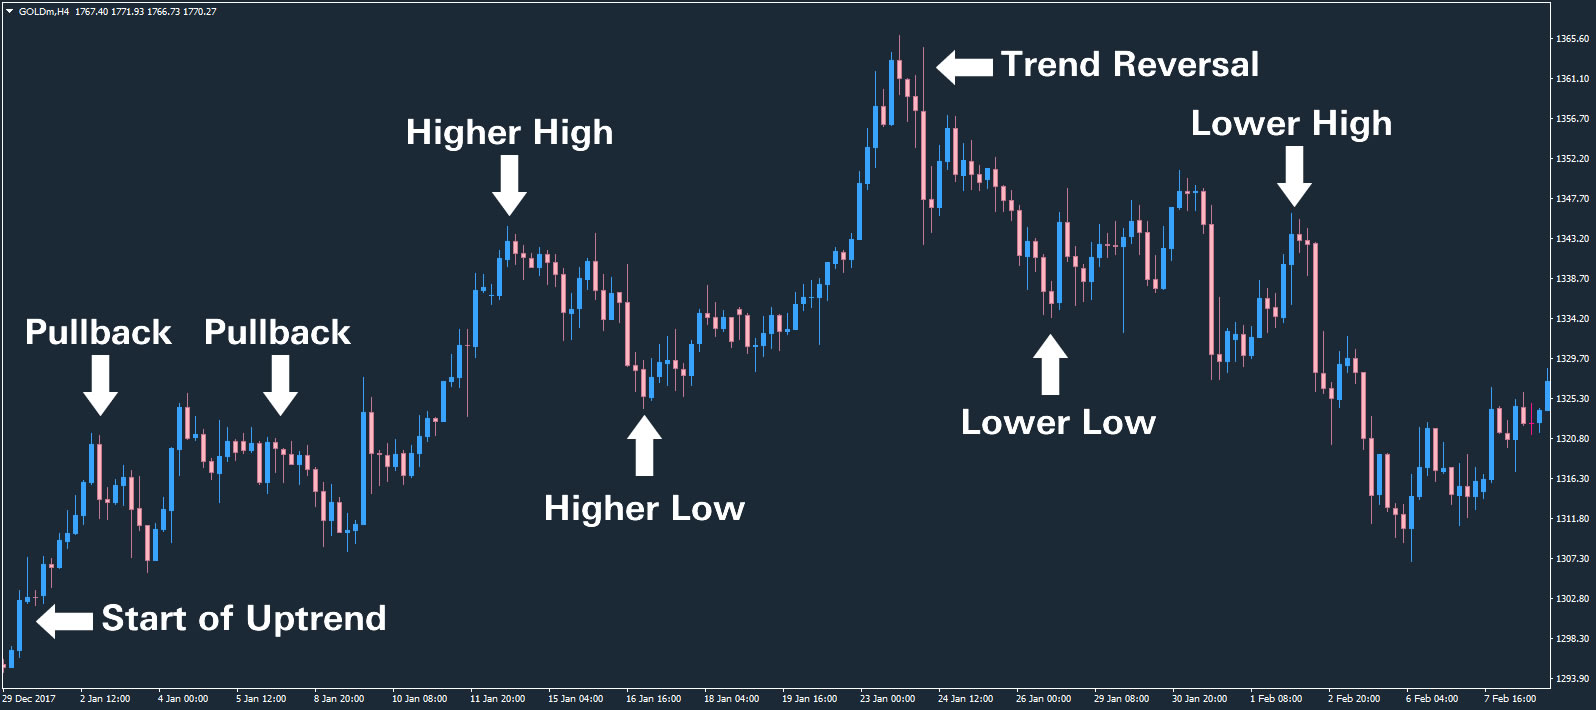
A strong uptrend (or bull market), is recognisable by a series of higher highs and higher lows, whereas a strong downtrend (or bear market), can be identified by lower lows and lower highs.
This chart on the Gold/USD CFD demonstrates all of these characteristics:
How to Determine the Trend
Conventional technical analysis states that during an uptrend you have higher highs, because buyers are in the majority and push prices higher, and lows are also higher because buyers keep buying dips/pullbacks earlier.
This also applies during a downtrend: lows are lower because the volume of sellers move prices lower, while highs are lower because sellers keep selling rallies/pullbacks earlier.
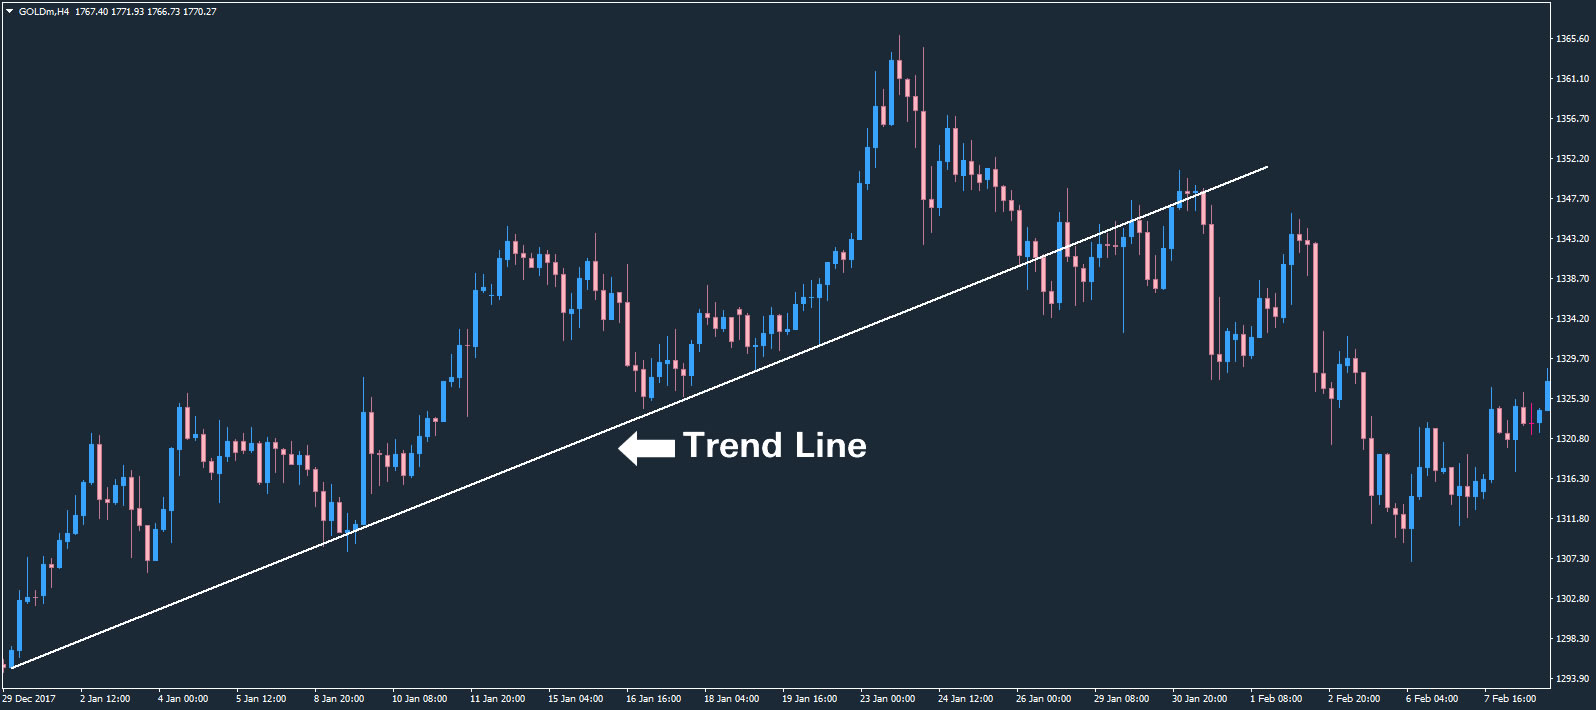
You can apply a trendline to your chart to assist you in identifying trends. Often, this will also help you identify areas where pullbacks are likely to reverse, as shown in the chart below:
Ranging Markets
Markets are not always in clear trends. There are consolidation periods in markets, which are also known as sideways or range-bound markets.
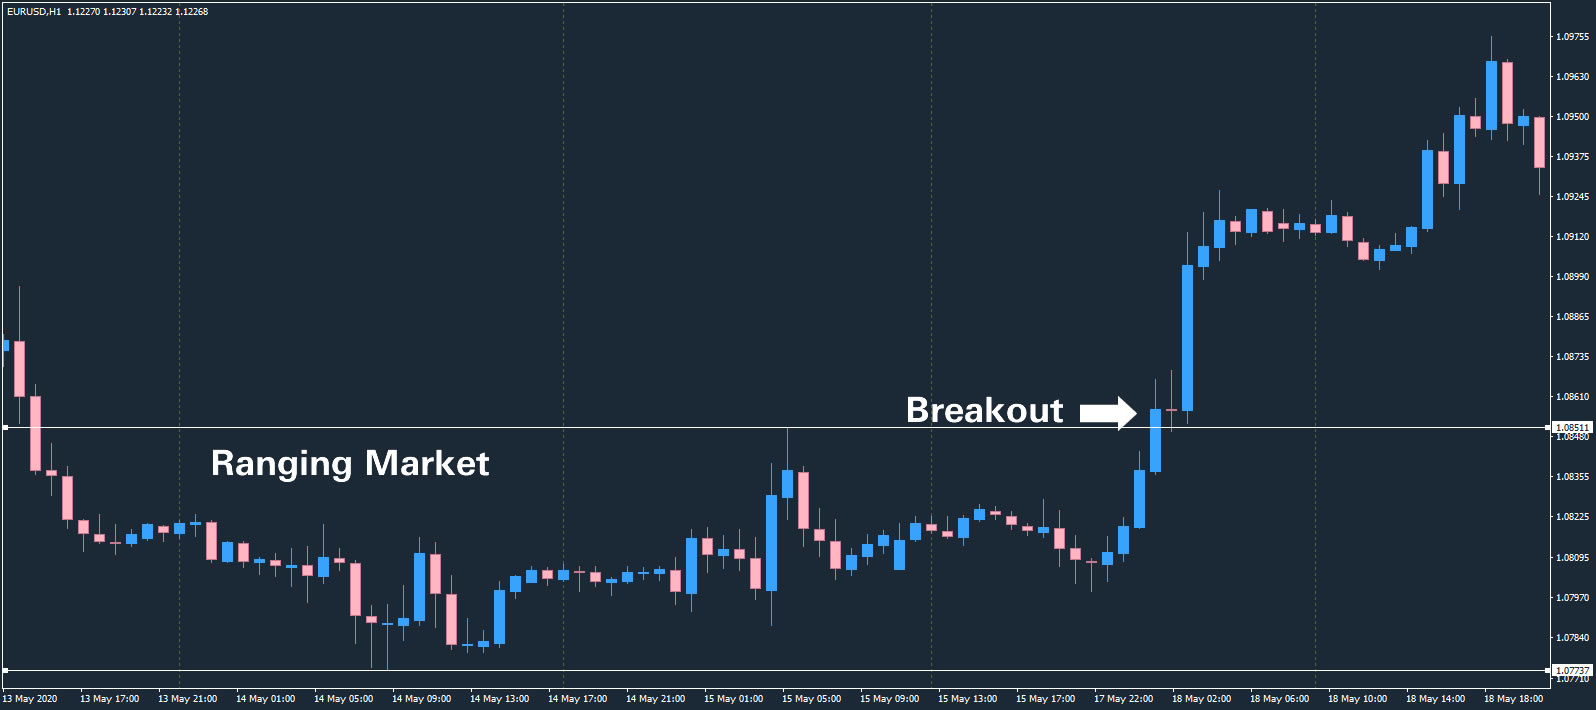
Markets range for a variety of factors. They can be caused by times of low liquidity, or when there is indecision between buyers and sellers, and there is insufficient consensus to move the market strongly in one direction or another. Buyers and sellers test each other, but no true consensus emerges. Some retail traders will employ a range trading strategy, whilst the majority will simply wait for a consensus to form and trade the resulting breakout.
This is illustrated in the chart below. The EUR/USD pair was in a range of 76 pips for more than two and a half days. Eventually the bulls took charge, resulting in a gain for the Euro of almost 600 pips!
Time Frames & Trends
It’s important to remember that time frames in trading are fractal – the smaller the time frame the more detail you see of the larger time frames.
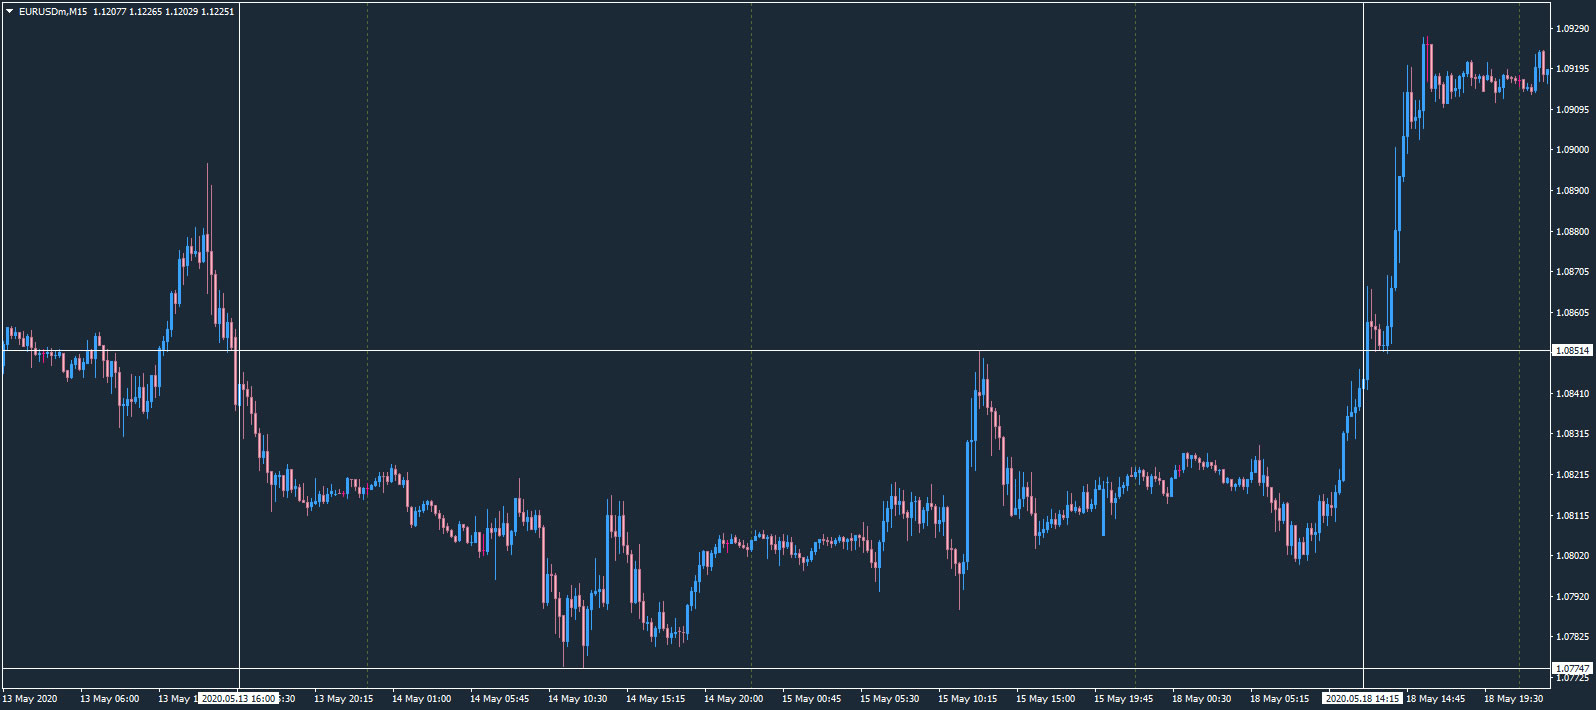
In the example of the EURUSD range-bound market we just examined, a swing trader may have identified the ranging market and waited for a possible breakout using one hour (H1) charts.
However a day trader using fifteen minute (M15) charts would have had several good opportunities to trade, and may not have noticed or cared too much that the market was in a range on a higher time frame:
The beauty of modern trading is that we have access to many different instruments, on many different time frames, and can easily look for trending instruments throughout the day.
It is important to learn the different individual characteristics of each market though, and traders should always adhere to the rules of their trading system and their trading goals.