
Fundamental Analysis
In this lesson we will cover:
– The basics of fundamental analysis
– The differences between fundamental and technical analysis
– Fundamental analysis in Forex trading
– Fundamental analysis in CFD trading
– Resources to help you conduct fundamental analysis
The two most common types of analysis when it comes to financial markets are technical and fundamental analysis.
Technical analysis focuses predominantly on monitoring and visualising price action, trends and patterns to help identify buying and selling entry points. Fundamental analysis considers non-chart data to determine the relative value of a market.
It should be noted that fundamental analysis and technical analysis can also be combined – the more clues as to where price may move next, the better.
Performing detailed fundamental market analysis before initiating a trade can make a significant difference in the overall success of a position in the market. This is especially true for longer term swing traders and position traders.
As we have already seen in an earlier lesson, for shorter term traders – like day traders – fundamental analysis can be as simple as looking at upcoming news announcements and looking for clues as to how the markets will react if the news is as expected, or better or worse.
What is Fundamental Analysis?
Fundamental analysis is one of two main methodologies for evaluating and forecasting movements in currency exchange rates, as well as for prices of equities, securities, commodities or any other publicly traded asset or financial derivative.
Fundamental analysis in Forex trading requires traders to determine how a currency will react to macroeconomic events, such as Central Bank monetary policy and political and social news from the nation of the respective currency.
Additionally, traders can also examine the same data for the other currency in a given currency pair.
Currency pairs react to the release of economic data, geopolitical and local news events. Unexpected news or events can make the Forex markets extremely volatile.
Fundamental Analysis Versus Technical Analysis
Fundamental and technical analysis are the primary ways traders review economic and market conditions to determine future direction.
While the focus of fundamental analysis generally remains on news, sentiment and the release of economic data as an indicator, technical analysis relies on the price and price movements of the underlying asset.
In addition to looking for patterns on charts of the exchange rate itself, technical analysts also compute and use a number of other related technical indicators to determine directional trends and momentum in exchange rates. These include oscillators, moving averages, chart drawings and patterns.
We will cover technical analysis in detail in the next chapter.
Technical methods do have some drawbacks – all technical traders are looking at similar data, which can produce a herd mentality. It can also be argued that technical analysis can become a self-fulfilling prophecy that produces strong trends.
Fundamental analysis has traditionally been better suited for traders who operate on longer time frames. The method involves analyzing a nation’s overall economic strength, its interest rates, central bank monetary policy, money supply, trade and current account balances, as well as the country’s overall political stability.
Fundamental Analysis in Forex
The main areas that fundamental analysis traders in Forex look at are listed below.
Interest rates
If a country raises its interest rates, its currency will likely strengthen because investors will shift their assets to that country to gain higher returns.
Employment Numbers
An increase in unemployment is considered a sign of a weakening economic that could eventually lead to lower interest rates, which has a negative impact on the currency, as investors move their capital into better performing assets.
Trade Balance & Budgets
A country with a trade surplus and current account surplus will likely see its currency increase in value. More money flows into the country than flows out of the country, year after year, and some of this wealth is “stored” in the strength of its currency.
Conversely, a country with a consistent trade deficit and current account deficit builds up debts to other countries, finds its reserves depleted, and may eventually be forced to sell some of its assets to foreigners.
Gross Domestic Product (GDP)
GDP is reported quarterly and is followed very closely as it is a primary indicator of the strength and health of an economy.
A high GDP figure historically leads to expectations of higher interest rates, which generally cause the value of that currency to rise.
Fundamental Analysis in CFD Trading
We will now look at two types of CFDs – Commodities and Indices – and examine how fundamental analysis can be applied to each sector.
Commodity CFDs
The main basis for fundamental analysis in Commodity CFDs, and Commodity trading in general, is supply and demand.
– If Demand > Supply = Higher Prices
– If Supply > Demand = Lower Prices
Commodities trade in cycles. Sometimes the supply of a given commodity – like oil or gold – will be tight, and this will push prices higher.
At other times, there is too much of a commodity and prices fall.
A simple strategy traders use is applying fundamental analysis in commodities that are trading at multi-year highs or lows.
This may signify that supply, or demand, is about to fall, leading to a reversal of the trend.
Supply of Commodities
The supply of a commodity is the amount that is carried over from the previous year(s) of production (stockpiles) and the amount that is being produced during the current year.
For example, the current supplies of soybeans include the crops in the ground and the amount that is left from the past crop years. Typically, the more that is carried over from the previous season, the lower the prices tend to move.
Demand for Commodities
Demand for commodities is the amount that is consumed at a given price level. The rule of thumb is that demand will increase when the price of a commodity moves lower.
Conversely, demand will decrease as the price of a commodity moves higher.
There is an old saying among commodity traders that “low prices cure low prices”. This means that more of a commodity will be consumed at lower prices, which lowers the supply and thus prices will eventually increase.
We will cover this topic in much more detail in a future lesson in our Intermediate course.
Indices
When trading Indices CFDs, a range of underlying fundamental variables can affect the price of an individual index. Traders must be aware of these variables and their possible impact on the index. These variables can range from macroeconomic variables to the fundamental composition of the index.
Here are some of the main drivers of price movement in the Nasdaq 100 index, as an example.
Composition & Weighting
The largest companies in the Nasdaq 100 can have a much greater influence on the index than smaller companies. The Nasdaq is a market-capitalization weighted index, so the largest companies – like Apple, Microsoft and Amazon – tend to move it the most.
Other indices may be weighted differently, and this can affect the way price moves. It is important to understand the differences between the major indices, their composition and the weighting that is used.
Monetary Policy
Changes in the Federal Reserve’s stance on monetary policy can have adverse effects on all stock markets, including the Nasdaq 100 index.
Economic Data
Economic data such as inventory levels, employment, CPI, interest rates and GDP. This data can signal what actions the Central Bank (in this case the Federal Reserve) will take on monetary policy.
Trade & Currency Wars
Trade wars and currency wars can impact large companies in the Nasdaq by way of tariffs and trade barriers.
Resources
There are many websites that provide free market analysis and outlooks using fundamental analysis.
To get you started, you may want to look at the following resources:
Forex Factory News
Forex Factory syndicates news stories from mainstream and alternative news websites on their News Page
(Please note, we are not responsible for content on third-party websites)
FXStreet News & Analysis
FXStreet provides fundamental analysis, mainly from their in-house analysts, on their News Page
(Please note, we are not responsible for content on third-party websites)
The Economist’s “Big Mac Index”
This is a somewhat tongue-in-cheek index, but it may have value in assisting your fundamental analysis if you are a position trader.
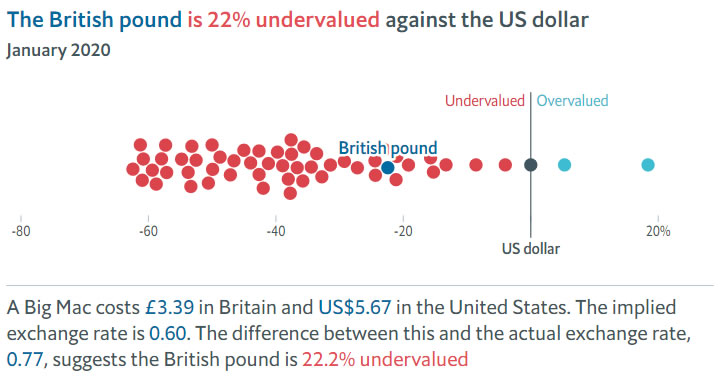
The Big Mac Index was invented by The Economist in 1986 as a lighthearted guide to whether currencies are at their “correct” level. It is based on the theory of purchasing-power parity (PPP), the notion that in the long run exchange rates should move towards the rate that would equalise the prices of an identical basket of goods and services (in this case, a burger) in any two countries.
You can find the Big Mac Index on the Economist website
(Please note, we are not responsible for content on third-party websites)