
Technical Analysis
In this lesson we will examine:
– The concepts underpinning technical analysis
– The different types of indicators
– Price action trading
Broadly speaking, there are two approaches that traders use to access the market in order to determine whether a market will go up or down. These are known as fundamental analysis and technical analysis.
While fundamental analysis focuses on the economic information of a company, commodity or currency, technical analysis focuses on the use of charts to predict potential future price movements.
Technical Analysis
Pure technical analysis only considers price movement, ignoring fundamental factors, since factors affecting the market price are assumed to be represented in price movements. Therefore, all that needs to be examined is the price itself.
Of course an unexpected event – such as a natural disaster or geopolitical event – may affect certain markets, but a technical analyst is not necessarily interested in the reason. A technical analyst focuses on indicator readings, patterns and chart drawings directly on the chart.
Trend Trading
In technical analysis, price movements are believed to follow trends. This means that once a trend has been established, future price movement in that direction is considered more likely. Most technical trading strategies are based on this concept, although some technical analysts employ strategies for trading trend pullbacks, counter-trends and even ranging markets.
Basic Types of Technical Indicators
Technical analysis is mostly done by using technical indicators, normally just referred to by traders as “indicators”. Indicators can be broken down into the following types:
– Moving averages
– Lagging indicators
– Leading indicators
– Patterns
– Drawing tools
Traders that perform technical analysis without using any technical indicators at all are known as “price action traders”.
Multiple technical analysis tools can be combined to create an overall trading system.
Moving Averages
Moving averages are a type of lagging indicator, but because they are so widely used, they form a class of indicator all of their own.
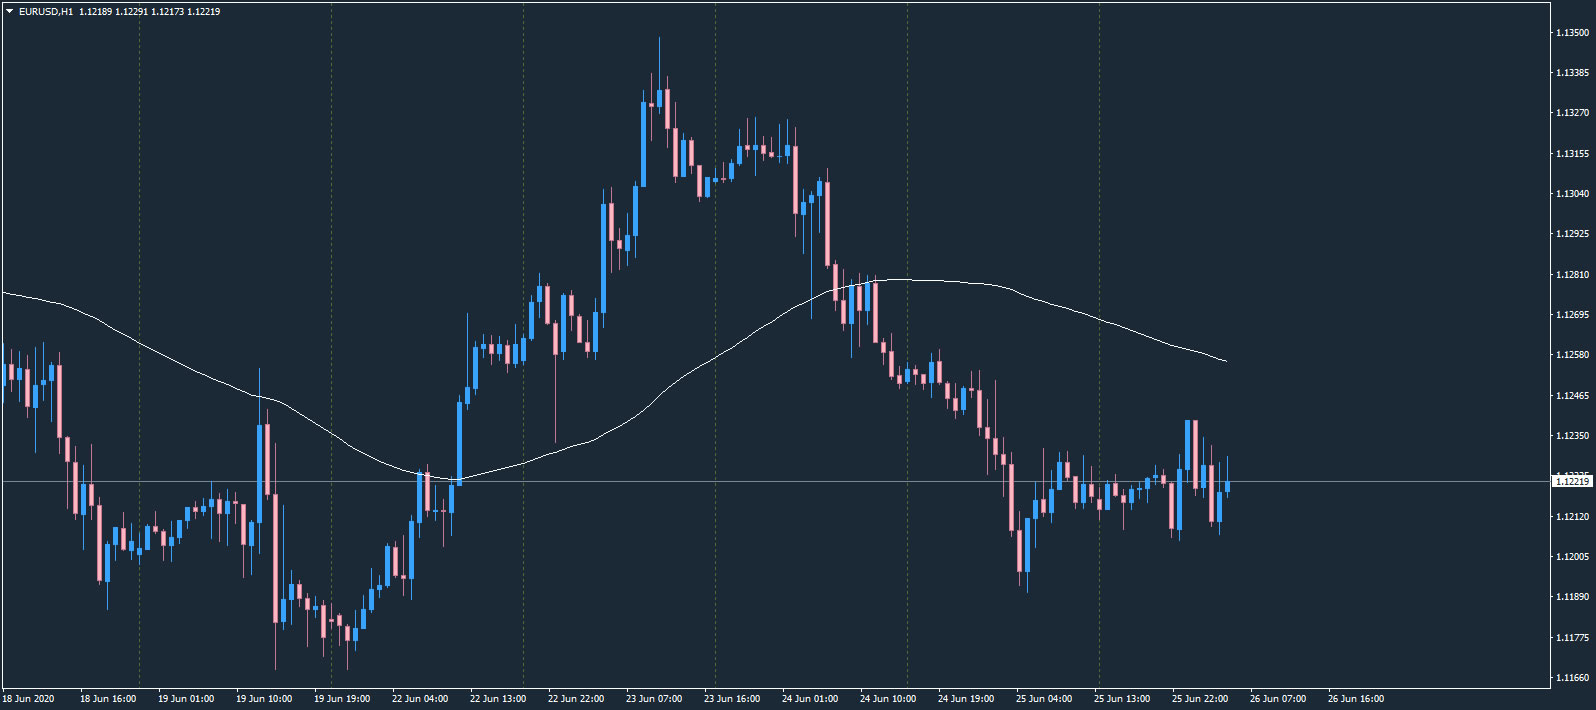
Moving averages are a totally customizable indicator, which means that an investor can freely choose whatever time frame they want when calculating an average. The most common time periods used in moving averages are 14, 20, 30, 50, 100, and 200 days.
The shorter the time span used to create the average, the more sensitive it will be to price changes. The longer the time span, the less sensitive the average will be.
Moving averages help smooth out the price data over a specified period of time by creating a constantly updated average price.
When price is above a moving average, it could signal a buying opportunity. When price is below a moving average, it could signal a selling opportunity.
However, moving averages should not generally be used on their own – when price is ranging around the average, it creates a phenomena that traders call “choppy markets” or simply, “chop”. This can lead to many small losses, as there is no overall trend.
Lagging Indicators
Lagging indicators, as their name suggest, are a class of trend-following indicators that lag behind the price action, to a higher or lesser degree.
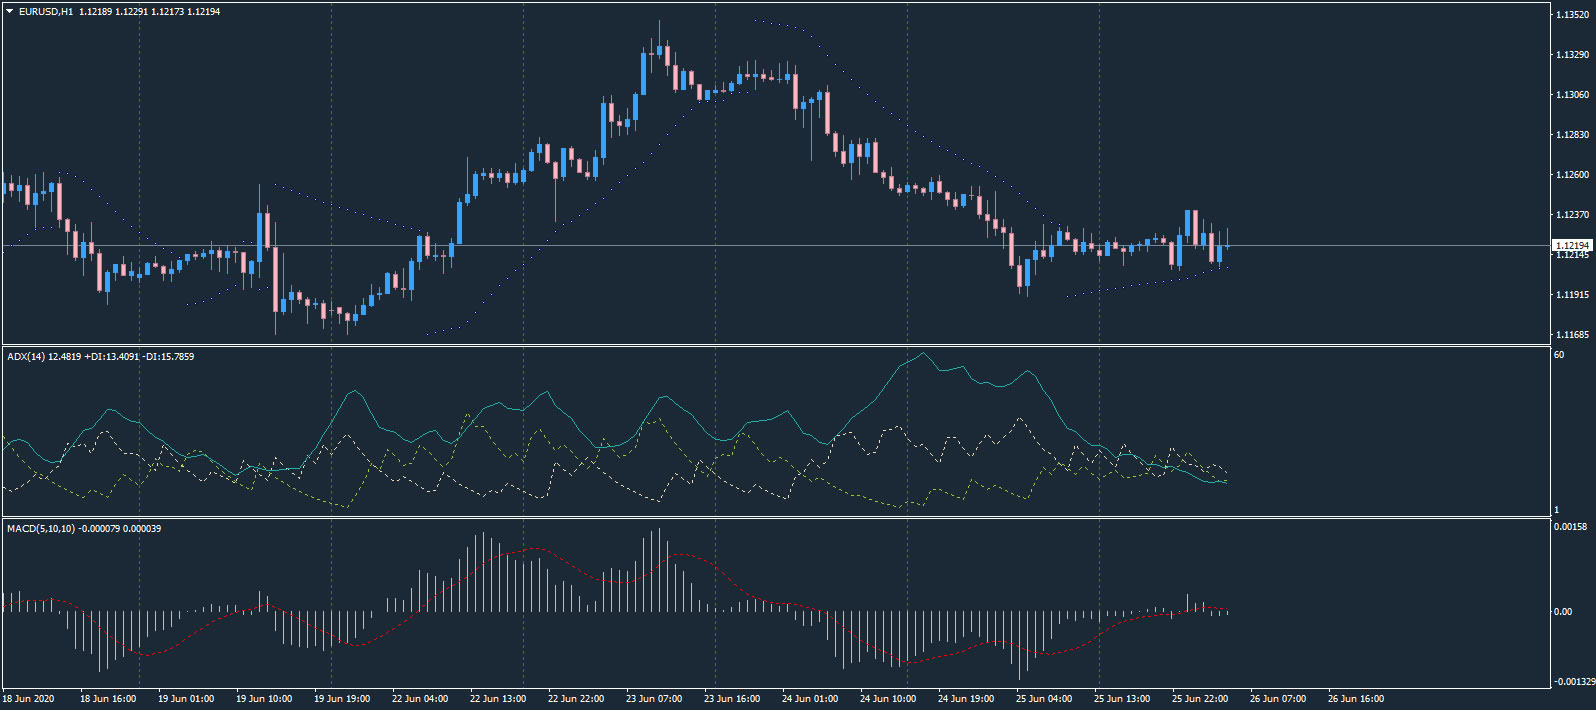
Lagging indicators include indicators that are directly on the chart itself, like the Parabolic Support and Resistance (PSAR), and “oscillators” that are displayed below the chart window, like the Average Directional Index (ADX) and the Moving Average Convergence/Divergence (MACD). These three indicators are shown in the image above.
Lagging indicators are useful, but it should be noted that sometimes they give their signals too late, and the trend has already reversed by the time you have entered the market.
Leading Indicators
Leading indicators are a class of indicators that give hints that the market is about to change direction. The biggest category of indicators in this class are overbought/oversold indicators, that give signals when there is such buying or selling pressure that price is expected to reverse, since traders believe the price is becoming too overvalued or undervalued.
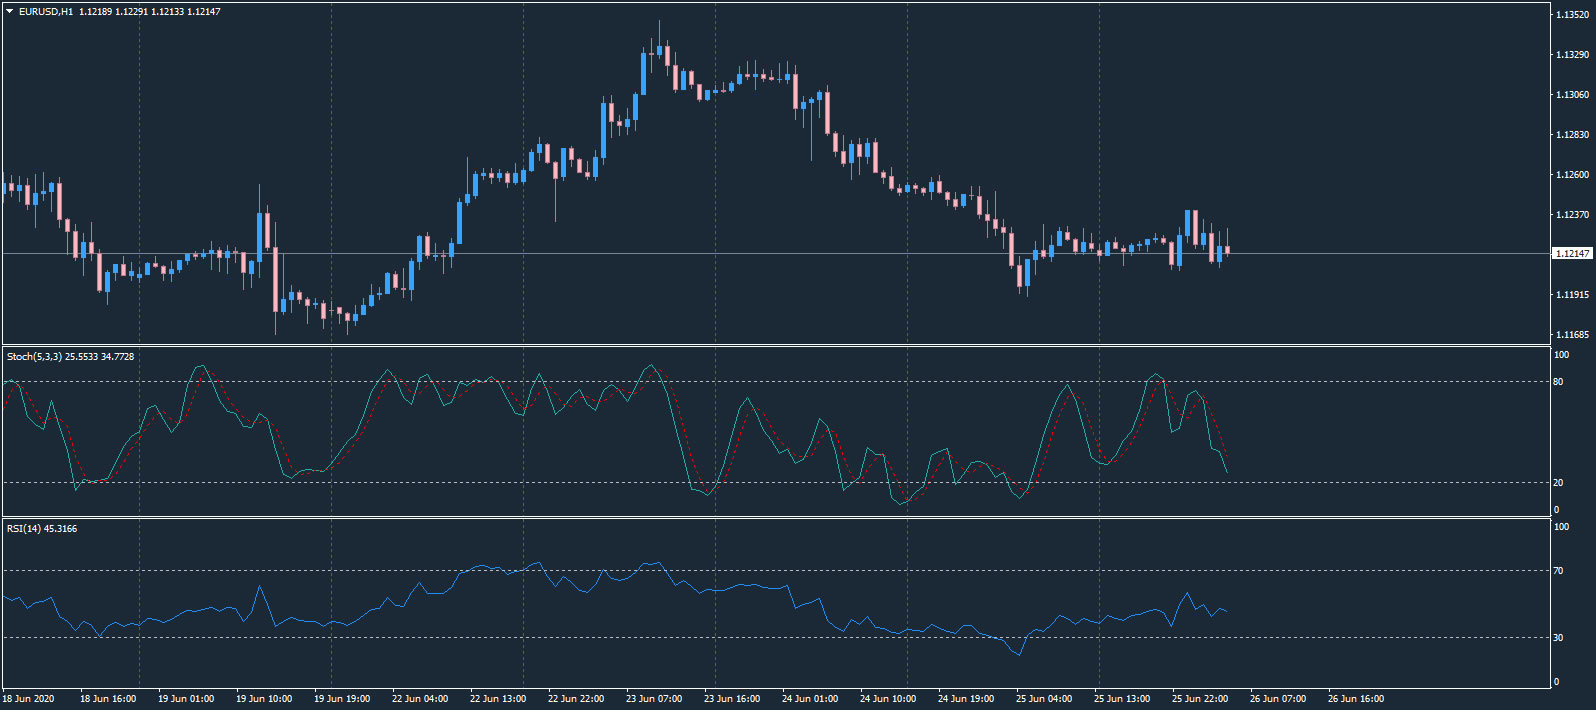
Leading indicators include two of the most widely-used indicators by traders, the Stochastic Oscillator and the Relative Strength Index Oscillator (RSI), as shown in the image above.
The Stochastic oscillator ranges from 0 to 100 and can be used to identify overbought and oversold market conditions. A reading over 80 reflects overbought conditions and gives an indication that the market may be due a reversal. Likewise, a reading below 20 reflects oversold market conditions and will also give an indication for a reversal in the market.
The Relative Strength Index (RSI) is a momentum oscillator that measures the speed and change of price movements. The RSI will oscillate between zero and 100. Traditionally the RSI is considered overbought when above 70 and oversold when below 30.
As with other indicators, leading indicators aren’t perfect, and may give signals too early, since the market may remain in a strong trend even though it is extremely overbought or oversold.
Pattern Trading
Pattern trading indicators are of a class that is completely different to other forms of conventional indicators.
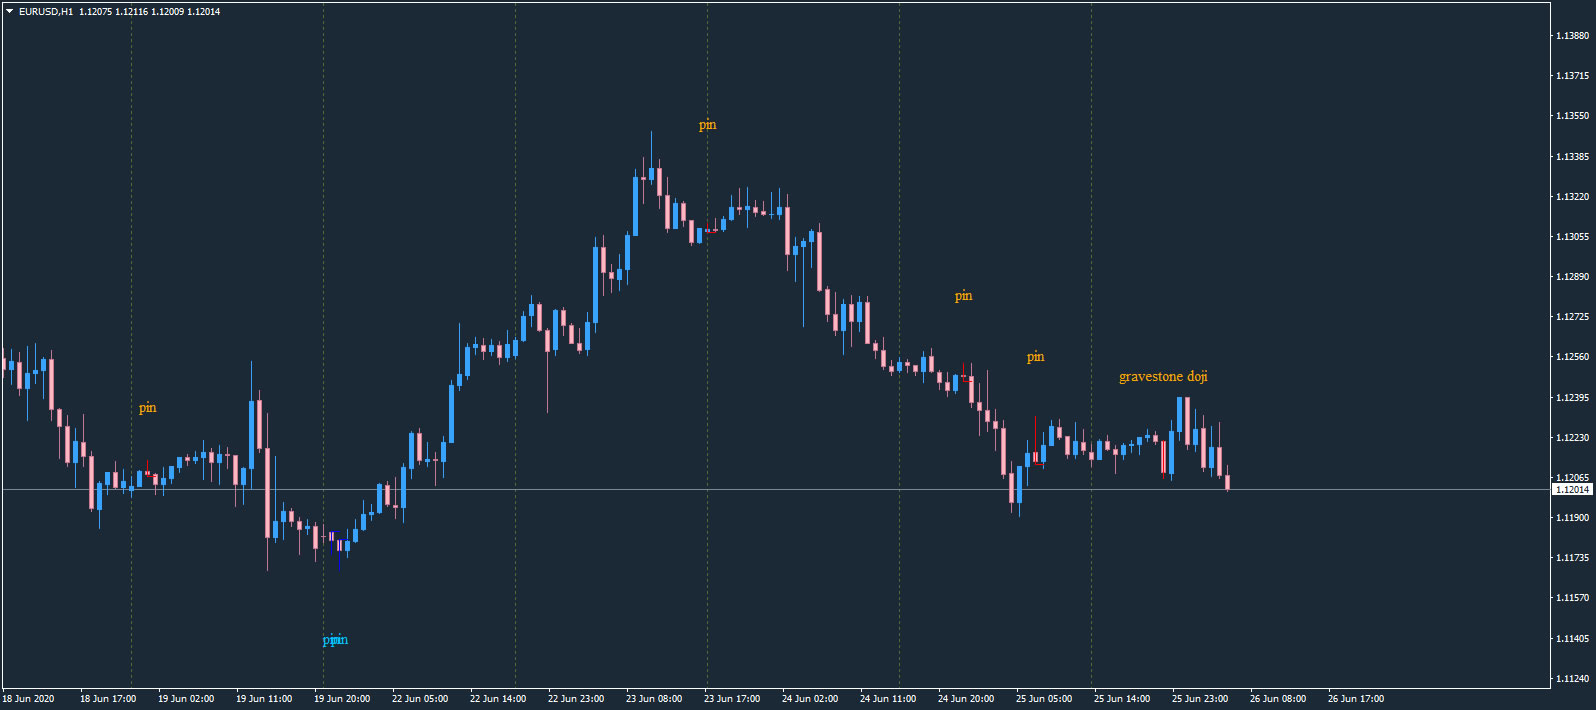
Pattern indicators include
– Pinbars and Japanese candlesticks – shown in the above image
– Harmonic patterns and Waves, often based on Fibonacci sequence
– Price patterns such as Head & Shoulders reversals
Pattern-based trading is extremely complicated and is sometimes controversial – some traders swear by it and some claim it is pseudo-scientific. However, like all other technical analysis tools, it has its place, especially when combined with other analysis methods.
Drawing Tools
Drawing tools are a class of visual aids that allow traders to draw their own “indicators” manually on their charts. MetaTrader4 has an extensive suite of drawing tools.
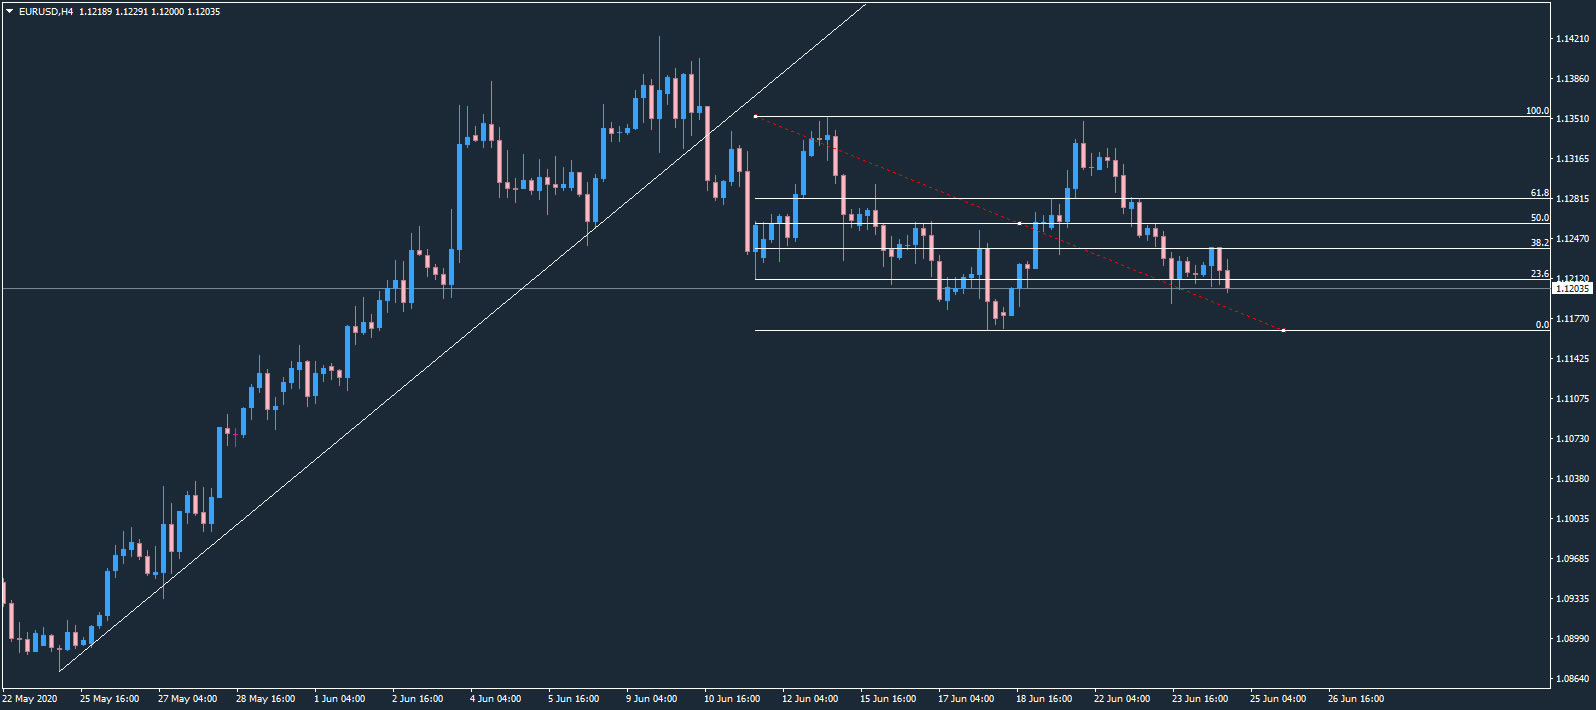
In the above image, a Fibonacci Retracement tool has been utilized, together with a Trend Line. Drawing tools can also be utilized to manually draw support and resistance levels. We will cover this in more detail in a future chapter.
Learning to use the drawing tools within MT4 can be very beneficial to your trading decisions.
Price Action Trading
Price action traders pride themselves on not using any indicators at all (also known as “trading naked”, because their charts have little to no indicators). Although they may draw trend lines, support and resistance levels and look for patterns, such as pinbar reversals, they try and focus purely on the price action and make decisions based on clues as to what the market is telling them, rather than relying on lagging or leading indicators.
Final Thoughts
Technical analysis is a fascinating and complex subject. It is recommended that you study it in more detail and develop a trading system with these tools that suits your trading goals and lifestyle.
Whichever analysis tools you decide to use in your trading, remember that, in addition to requiring a statistical “edge” over the markets, the key to trading is discipline, patience, risk management and controlling your emotions.