
Support & Resistance
In this lesson we will cover:
– Identifying support and resistance levels
– Bounces and breaks
– Specific levels to look out for
Two common terms you’ll come across in trading – particularly in technical analysis – are the phrases ‘support’ and ‘resistance’ levels. In this lesson you will cover what these terms actually mean, and how they apply to your trading.
Support & Resistance
Support levels are found below the current price of an instrument and tend to be where falling prices find a floor of support.
Price is more likely to “bounce” upwards from this level, rather than “break” through it.
A resistance level is found above the current price of an instrument, and acts as a ceiling for prices as they rise. The opposite of a support level, resistance levels mean that the price is more likely to bounce downwards from this level than break through it.
Traders should be aware of recent support and resistance levels for two reasons.
You should be cautious of placing a new trade that looks to break through these levels as price may bounce off the level and immediately hit your stop loss.
If you are already in a winning trade, you may want to consider taking profits once the price gets to the level in question.
Identifying Support & Resistance
There are several technical analysis indicators and tools that can assist help in identifying levels of support and resistance, which include:
– Previous Tops & Bottoms
– Patterns
– Moving Averages
– Trend Lines
– Bollinger Bands
– Fibonacci Retracement
– Pivot Points
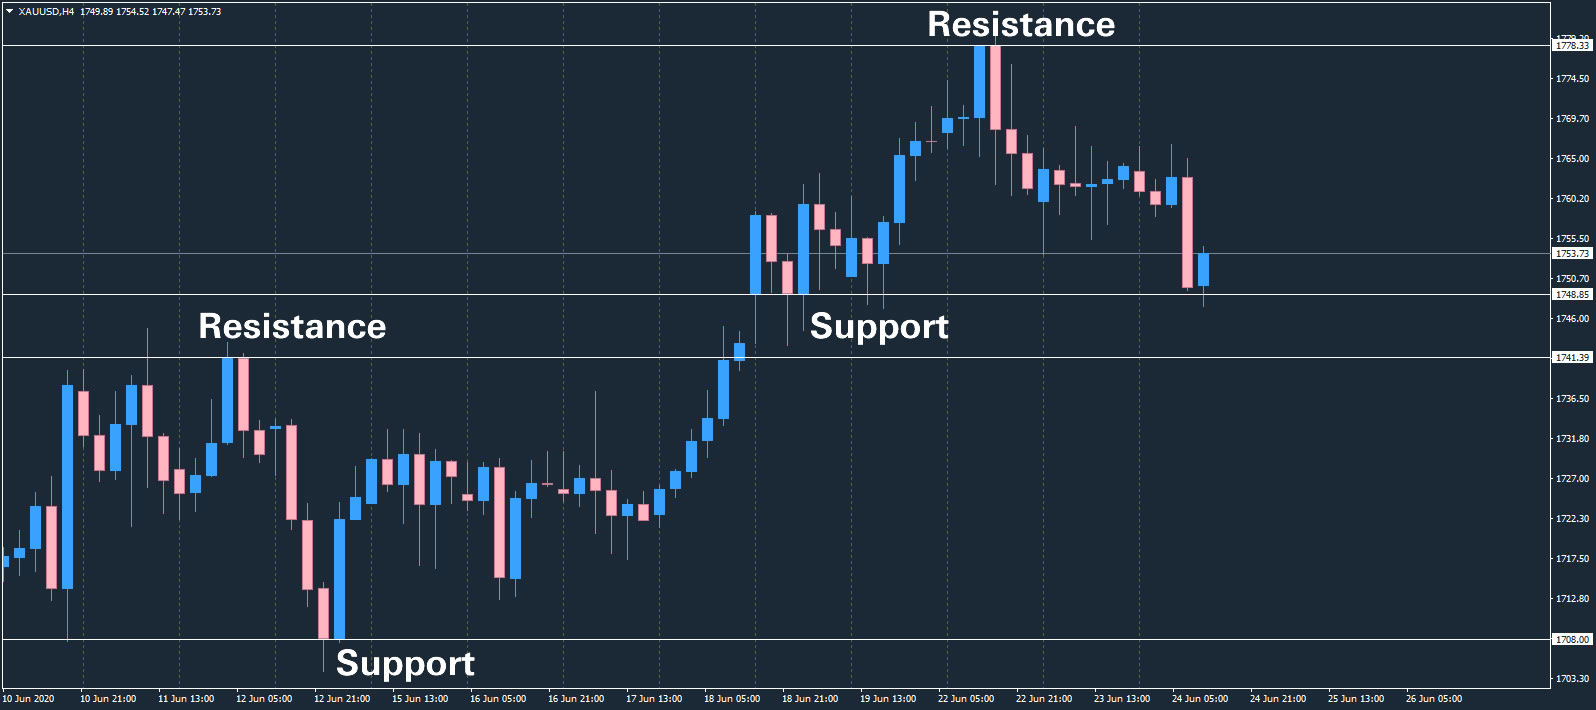
The below chart for Gold/United States Dollar (XAUUSD) shows support and resistance levels using manually drawn Trend Lines using the inbuilt MT4 drawing tools.
Psychological Levels
When support/resistance levels are broken, a break or bounce typically takes place – until another support or resistance level is found.
A bounce is where the price of an instrument rebounds from the level that was identified as resistance or a support.
A break of support or resistance is an important moment in trading as it often leads to the establishment of a new trend, as more and more traders take positions on the new movement of price.
Additionally, after a support or resistance level is broken, it may become a new level of support or resistance in future.
It should be noted that retail traders are typically cautious when price reaches a “whole number”. Additionally, other levels may form psychological barriers where the market as a whole believes that any breach of that price would be overvalued or undervalued.
This chart from the EURUSD pair shows an example of both a whole number psychological barrier and another key psychological resistance level:
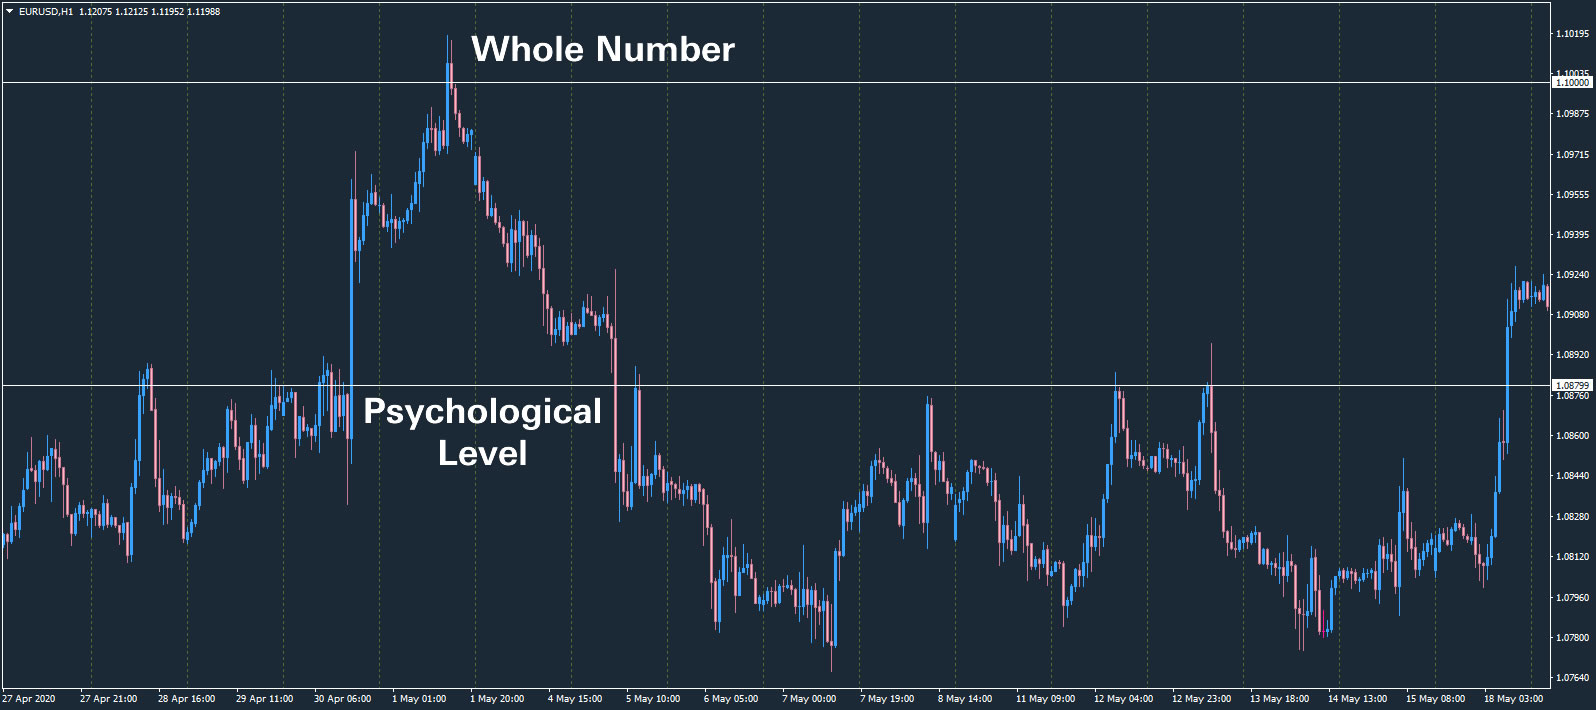 As we can see from the above chart, the psychological level was tested and finally breached. Price raced to the whole number (1.10000) and then dramatically retreated soon after the break of that level. Price then repeatedly returned to the previous psychological level and bounced off, before finally breaking through.
Final Thoughts
Learning to use support and resistance in your trading is extremely important. Financial institutions often place pending orders around these levels in the hope that naive retail traders will enter the market with sufficient volume to trigger their own entries and take your money!
Although support and resistance is quite a basic concept, learning to use it effectively will make you a more profitable trader in the long run.