Offline Charts
In this lesson we will examine:
– How to view offline charts
– How to use non-standard time frames in MT4
– How to use renko, range bars, tick charts and other non-standard chart types
– How to backtest using offline chart data
Offline charts are a feature of MT4 that allows traders to trade on chart time frames and types that aren’t possible otherwise. For example, if you wanted to trade on a two hour chart, three day chart, three month chart and so on, then this is possible using the offline chart feature.
Additionally, many traders these days utilize non-standard charts – for example, tick charts or range bars – for both manual trading and when using EAs.
Finally, we will look at how to backtest on some of these offline charts using the MT4 Strategy Tester.
Offline Charts – Basics
In MetaTrader 4, you have a limited choice of available time frames to trade on. However, Offline Charts allow you to extend the functionality and they provide a basis for completely new charting methods.
Generating Offline Charts is done via an indicator, an EA or a script. To start with, let’s look at a built-in script in the MT4 platform – PeriodConverter.
Using Period Converter
In this example, We will use the PeriodConverter script to generate a two hour (H2) chart.
First, we need to ensure that AutoTrading is enabled.
Select “Tools” from the top menu, then select “Options”:
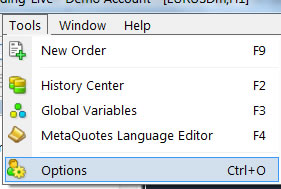
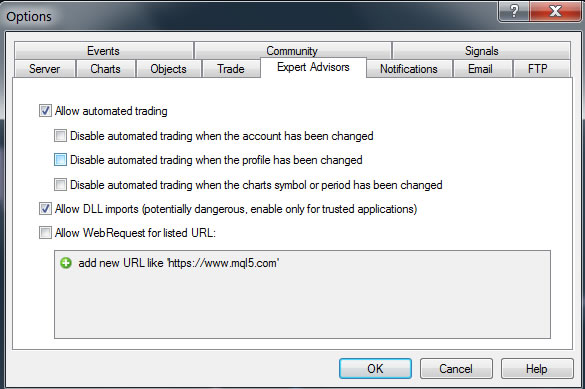
From the Options box that now appears, select the Expert Advisors tab, and check the “Allow automated trading” box:
Hold the “Ctrl” button on your keyboard and tap the “N” button to bring up the Navigator. Select the PeriodConverter under “Scripts”:

Then drag it from the Navigator onto your chart.
This box will appear:
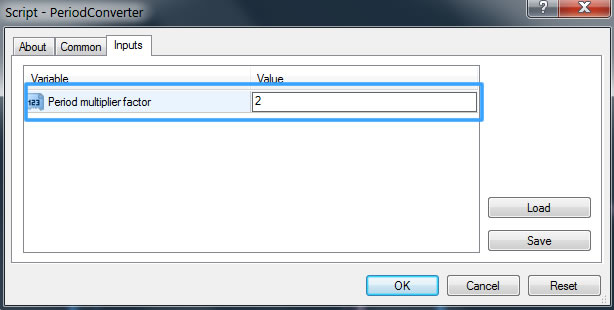
We dragged the PeriodConverter onto an H1 chart. Because we want to create an H2 chart, the “Period multiplier factor” is 2.
If we wanted to make an H3 chart, we would select 3 as the variable.
Additionally, we could have used an M1 chart, making the “Period multiplier factor” 60 for an H2 chart, or 4 if using M15 as the starting chart.
Click the OK button and the script will create the offline chart.
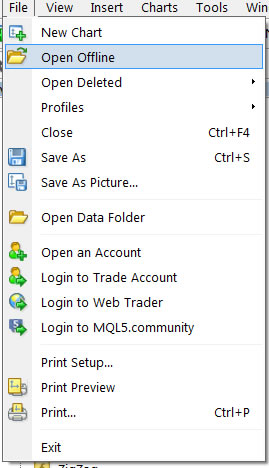
To open the chart, select “File” from the top menu, then select “Open Offline”:
The Open Offline Chart dialogue box will now appear:
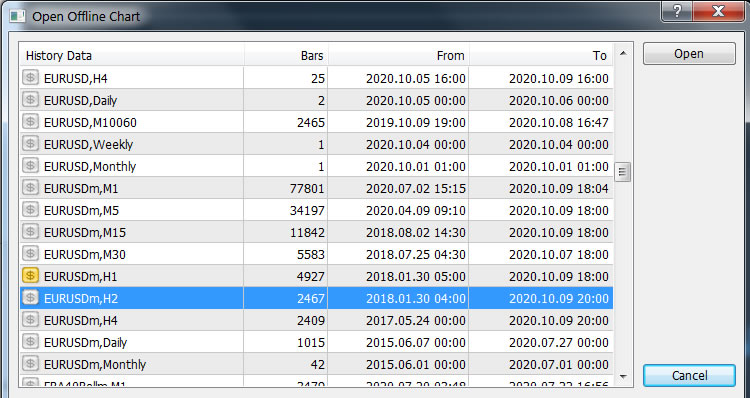
Navigate to the instrument you generated the chart for, and double click on it with your mouse.
The offline chart will now open, as we can see in the image below:
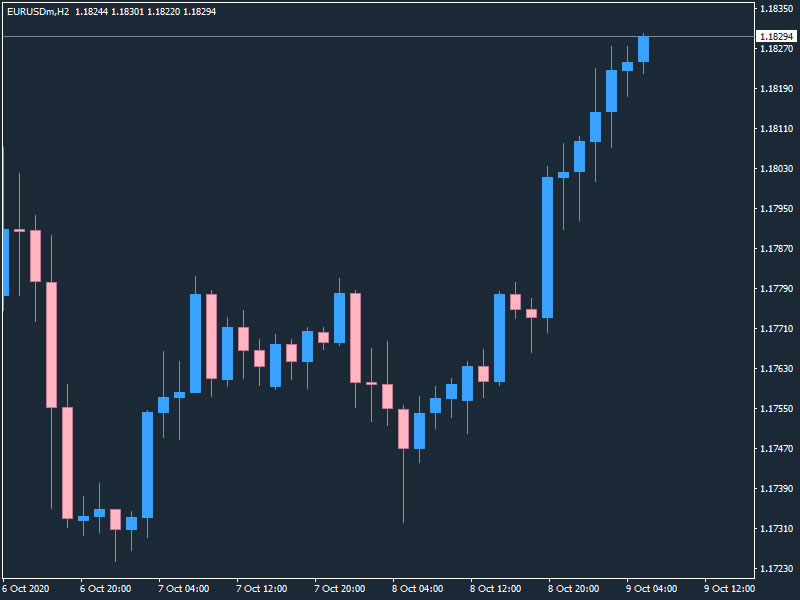
Tip: Save a chart template design you like as a template with the name “offline.tpl” and your offline charts will automatically use this template when you launch them.
Tip: Always keep the “base” chart open that you used to generate your offline chart. This ensures that you will continue to receive live price data on the offline chart. In this example, the chart we need to keep open is the EURUSD H1 chart. This chart needs to remain open since the script is running on it, we can’t open a new H1 chart without reapplying the script. This is true whether you use an indicator, EA or script to generate your offline charts.
Now, let’s look at some examples of non-standard chart types.
Non-Standard Charts
Non-standard chart types are an extremely popular chart type these days, with traders utilizing many different chart types in their trading that don’t use time as a reference for creating new bars. These chart types include:
- Renko charts – including standard, hybrid, flex and mean renko chart types
- Range bars
- Tick charts (sometimes also called constant volume charts)
- Kagi charts
- Point & Figure (P&F) charts
- Point Original Charts
Many of these charting types (especially tick charts) have been utilized by Futures traders for a long time, but in the last ten years or so they have become extremely popular with the MT4 community.
Pros & Cons of Non-Standard Charts
The main reason traders use range bars, tick charts, renko and others is that they smooth the price action. This has the effect of turning what appear to be range bound markets into ones that have more clearly defined trends.
These chart types also give completely different entry points than when using time-based charts. You might get your signals earlier and attain better results with your system.
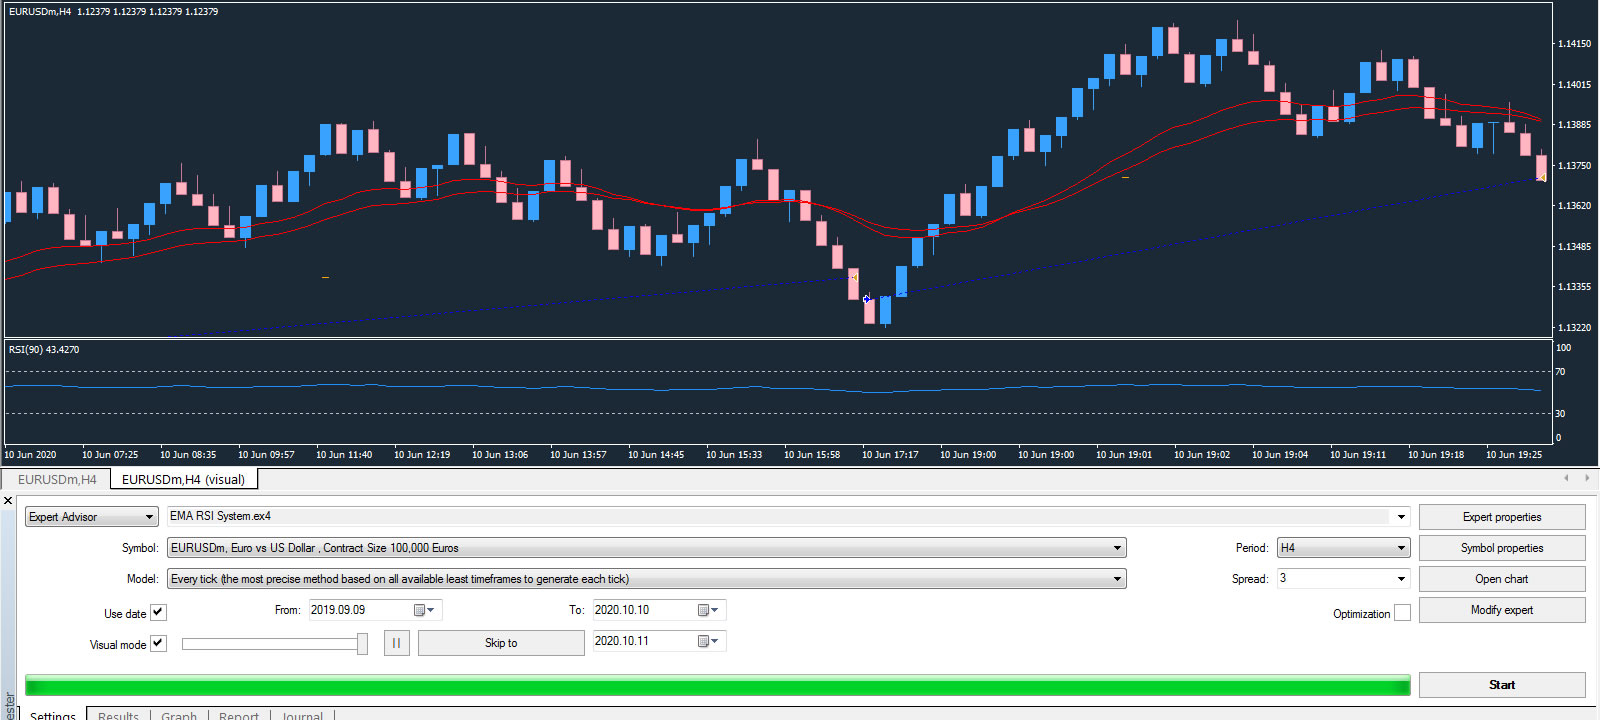
For example, if we take the simple EMA/RSI system we optimized in a previous lesson in this course, we can see that the exact same settings gave far better results using range bars, turning this:
into this:
It is important to note, however, that like all things in trading, this isn’t a “Holy Grail”, and there are complications that can result from using these chart types.
Firstly, if you are trading manually on these chart types, you need be aware that because they aren’t time-based, signals can come at any time of day or night, whereas a system based on, for example, Daily charts, means you only have to check the charts once a day to look for signals.
Secondly, as in the example above, we may have just “gotten lucky” and picked a range bar size that just happened to be perfect for this particular time period on this particular instrument (EURUSD). You can almost think of your pip/point size as another optimizable variable of your system. Since there is no way to backtest and optimize automatically on several different renko/range bar/tick pip/point sizes, we cannot know for sure if this was just blind luck or not without extensive, time consuming manual testing.
Finally, many of the best products and tools for backtesting on these types of charts are limited to 10,000 bars of test data, meaning we may need to run several backtests to get a complete overall test for our chosen time period (e.g. 5 years) when using smaller renko/range bar/tick pip/point sizes (e.g. 10 pips/points). However, we can “stitch” these tests together in QuantAnalyzer using the portfolio mode so the main drawback is mostly the amount of time needed to process the data and run the different required tests.
With that said, we will now take a look at the most popular non-standard chart types in the MT4 community today.
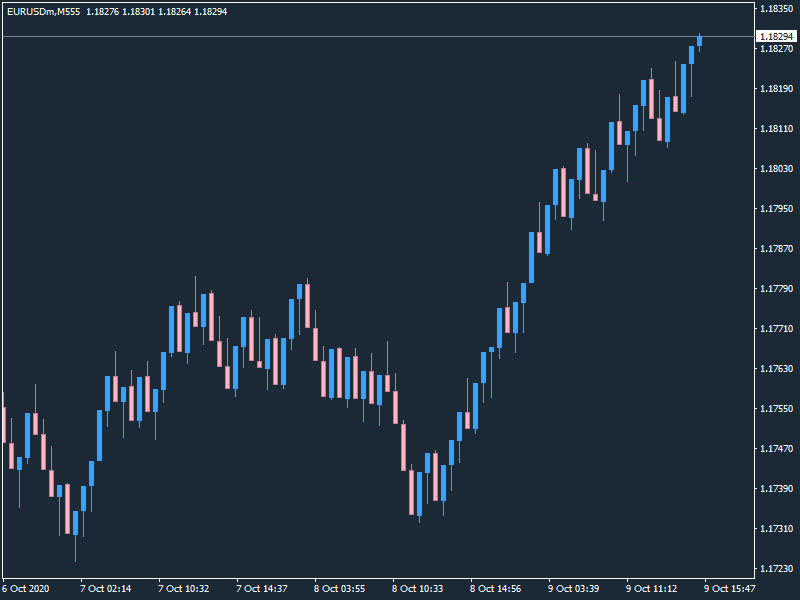
Range Bars
Range bars were invented by a Brazilian trader, Vincente Nicolellis. He designed these custom chart types in 1995 to smooth the price action of volatile Brazilian markets.
In a range bar, all price bars are of equal length. So for example, if you set a 10 pip range bar, then all bars are of a 10 pips range (high to low, or low to high).
Range bars always have the close of a bar to be equal to the open of the next bar. The range is measured as a high and low, and not the close.
A range bar chart looks like this:
Renko Charts
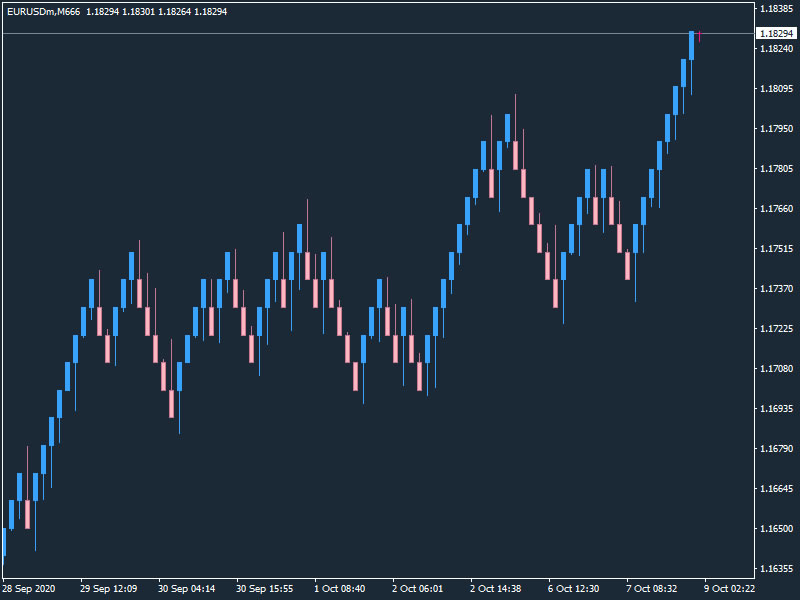
A Renko chart is a type of chart, developed by the Japanese. It is thought to be named after the Japanese word for bricks, “renga,” since the chart looks like a series of bricks.
A new “brick” is created when the price moves a specified price amount, and each block is positioned at a 45-degree angle (up or down) to the prior brick. An up brick is typically colored white or green, while a down brick is typically colored black or red.
A renko chart (with wicks) looks like this:
Tip: Be aware that if you backtest on renko, you may get unreliable results when testing certain EAs. This is due to the open of a new bar for renko being redrawn and the EA not recognizing the correct open point. This is a known issue when using renko and is not unique to the MT4 Strategy Tester.
Difference between Range Bars and Renko Bars
Range bars and renko seem quite similar but there are crucial differences:
| Range Bars | Renko Bars | |
| Using range bars, every bar is of the same length (price movement, both up and down are included in the range) | Using renko bars, every bar is of the same length (including reversals, but price must travel two times the renko bar in the opposite direction) | |
| Range bars typically have an open, high, low close | Renko bars have an open and close (if wicks are enabled you can see the high and low) |
Tick Charts
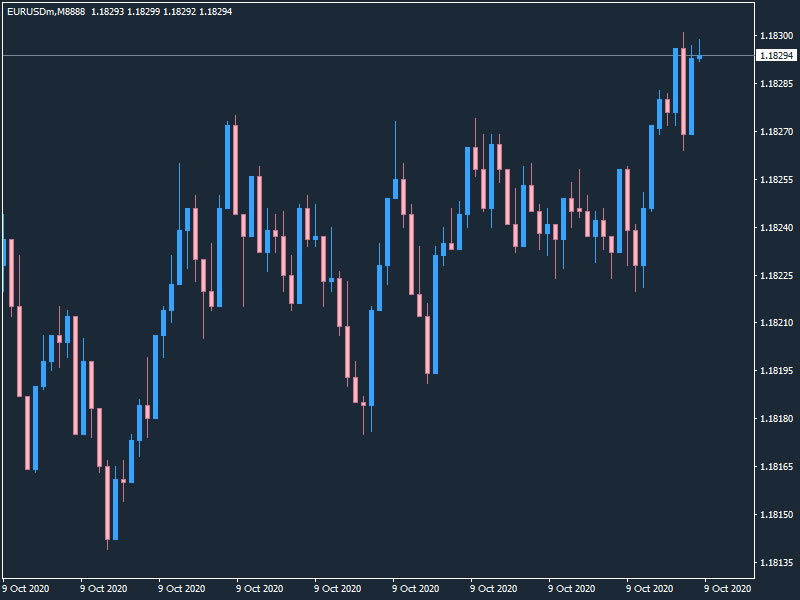
A tick chart, in the context of Forex, is the change in price of a Forex pair caused by a single trade. Instead of showing time-based charts, tick charts will only print a new candle after the number of user-selected trades has occurred. For example, you could specify 147, 254 or 379 trades, or any other number of trades that you feel works best. As with renko and range bars, the lower the selected number you select, the quicker the price action and formation of a new bar will be.
A tick chart looks like this:
Traders use tick charts because:
- It is easier to see momentum and strength of price action than with time-based bars. For example, if there’s a range break-out, you may see an entry opportunity earlier with tick charts, since bars in the same direction will follow each other quicker. This potentially allows you to anticipate big moves.
- Trend structures are more pronounced than with time-based charts.
- They show periods of low activity. If little trading is happening, new bars will take a long time to be printed, which gives clues as to range bound, or thinly traded markets with low liquidity and volatility.
However, remember that Forex is a decentralized exchange, and therefore the tick charts you see will be dependent on your brokerage and liquidity provider(s), and therefore you will only see trades from other clients of that brokerage, and other traders using the same liquidity provider(s) at other brokerages.
This means you will get different-looking charts (and different trading results) depending on which broker you use.
Backtesting Offline Charts
To backtest different chart types, we will require some additional software.
In the following examples we need a high quality data source, so you can use either Tickstory or Tick Data Suite. In this example we will be using Tickstory, but the process is extremely similar for Tick Data Suite.
We also need some scripts, for which will be using the library at Ovo. This company also publishes the “Omnia Bar” indicator, which was used to create all the non-time-based charts in this lesson.
Please refer to the video at the top of this page for detailed information about the setup and backtesting process, if you haven’t already done so.
Backtesting Any Offline Chart
To backtest on any offline chart (including charts created by the PeriodConverter script), we will use the “OfflineTestHelper” script – click the link and download the OfflineTestHelper.ex4 file and install it in MQL4 > Scripts.
Ensure you have downloaded high quality HST (.hst) files to your MT4 broker history file location. Then, simply drag the script onto the offlline chart you wish to backtest on.
This dialogue box will appear, click “Yes”:
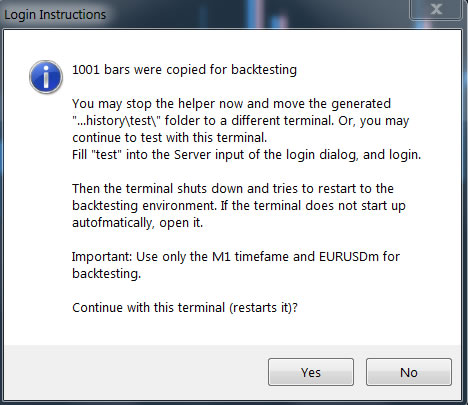
MT4 should now restart automatically. If it doesn’t, start it manually.
You can now backtest on the instrument you generated the offline chart for.
Remember to test on the M1 timeframe, as this is where the offline chart data is stored.
The maximum data quality with this method is 25% – this is due to limitations within MetaTrader, and this method should be considered a “workaround”. This backtesting method may not be as accurate as others we have covered in this Advanced Course, so be prudent when using this method.
Also be aware that this method sets the MT4 server to a “virtual” server named “test”. To reconnect to your normal broker server, simply login to your MT4 account again.
Backtesting Renko & Range Bars
To backtest renko and range bars, you will need the Renko FXT Builder and the Range Bars FXT builder. As before, download these files and copy them to your MQL4 > Scripts folder.
In this example, we will backtest on range bars.
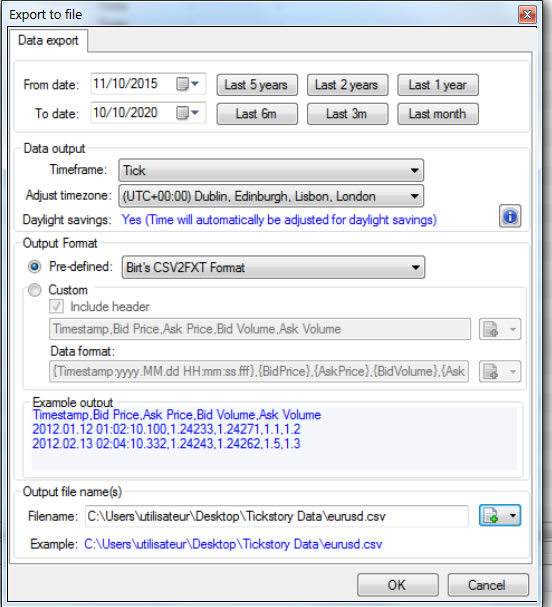
Instead of exporting FXT files to the “tester” folder from Tickstory, this method creates a CSV file which is then read by the script.
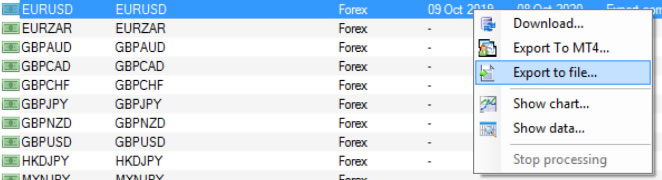
From the dialogue box, we will select the “Birt’s CSV2FXT” Format option:
Tip: If you save the CSV files you generate to your MT4 “templates” directory, this will make loading files into the FXTBuilders quicker, since this is the default folder the scripts use.
Now, drag the RangeBarFXTBuilder script onto the chart for the instrument you want to backtest range bars on. This dialogue box will open:
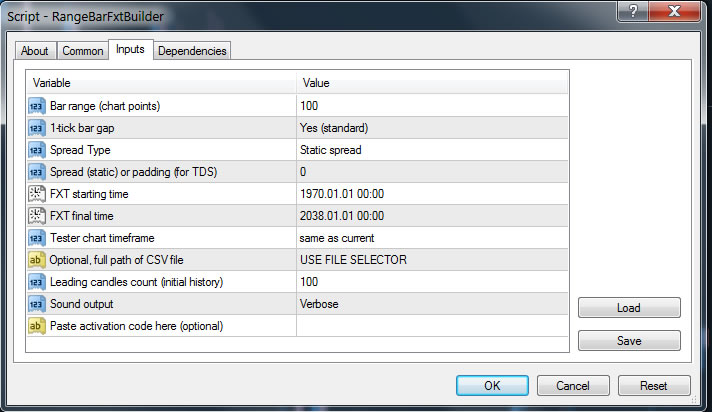
“Bar Range (chart points)” is the number of points/pips you want each range bar to be made up of. The default 100 means 10 pips in Forex.
You can keep all the other variables as the default, except for the “FXT starting” and “FXT final time”. These allow you to specify the exact dates to backtest. Leaving the default variables will use the earliest date range in your CSV file.
“Tester chart timeframe” specifies which time frame you will backtest on for your chosen instrument symbol. For example, if you dragged the script onto an H4 chart, you would be backtesting on H4 with the default setting. Otherwise, choose a different time frame from the dropdown menu.
Sound output = Verbose means that a text-to-speech voice will inform you when the test starts and finishes.
When you have set up everything to your requirements click “OK”.
In the next dialogue box, navigate to, and select the CSV file you just generated, and click “Open”.
The Builder will now start creating your range bar charts:
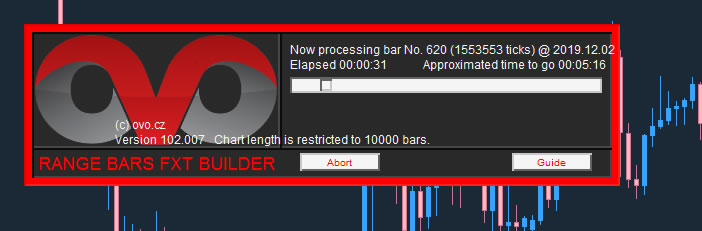
Once the builder has finished, simply select the symbol and time frame you chose to generate range bar backtest data for in the Strategy Tester. Unlike with the previous method we looked at, there is no need to restart MT4 and you will remain logged into your account and the trade server.
Congratulations, you can now backtest on range bars!