
Developing Trading Systems
In this lesson we will examine:
– The basics of developing a trading system
– Visually backtesting your system
– Developing custom indicators to make visual backtesting easier
Developing your own system is something that every trader will consider at some point. You may already have some ideas for a system, or perhaps you are using a system you found in a book or online, or bought, that you believe can be improved. In this lesson we will give some ideas as to how this might be achieved.
Select a Market and Time Frame
You can choose any market and time frame. However, it is important to narrow down your choices to save time and money. Developing your own system successfully can be a large investment of your time, and also financial resources to a lesser extent, if you are paying a developer to code your system.
Forex
If you are interested in trading Forex, it may be better to choose a longer time frame, since Forex price action isn’t as smooth as many CFD instruments. Many professional Forex traders use 4H charts to trade, as this allows them to check their charts only 2-3 times a day (e.g. 8am, 12pm, 4pm) and gives them plenty of time to perform technical analysis and to react to market conditions.
Using the 4H charts allows traders to analyze the trend on D1 and W1 charts, and much of the market “noise” on shorter time frames becomes irrelevant.
Some professional traders also trade lower time frames – for example the EURUSD pair is suitable for trading on M15, M30 and H1 timeframes. However, be aware that the smaller the time frame, the more screen time might be required and the more stressful the trading, as decisions need to be made more quickly.
Finally, be aware that if you want to trade “Exotic” Forex pairs, it may not be possible to trade profitably on lower time frames because the spread may be too large to enable you to achieve a sufficient risk:reward ratio to give your system an edge.
CFDs
CFD markets can move much faster and much further than Forex pairs. This provides great opportunity for potentially making profits but be aware this means you can also lose money quickly too.
Most professional retail CFD traders utilize M5, M15, M30 and H1 charts. They also typically trade using a “Day Trading” style, and close their positions before the underlying market closes. This alleviates the requirement to pay overnight swaps, and they don’t need to worry about what the market is doing overnight.
Define Entry Rules
The way you enter a trade is extremely important, but it should not be thought of as the “trading system” in and of itself, which is a mistake that many newer traders make. Risk management and your rules as to how you exit a trade are just as important.
There are essentially three different kinds of entry setup you can consider for your system:
Trend Trading
Trend trading is the most popular form of trading. When prices are moving up, you buy, and when prices are going down, you sell. You can also look to buy dips and sell rallies in an established trend.
Counter Trend Trading
Counter trend trading is difficult to develop systems for, since most indicators are designed to be trend following.
A counter trend trader would look to sell dips in an uptrend and buy rallies in a downtrend.
Some examples of counter trend indicators include divergence indicators and Harmonic patterns such as Shark Harmonic Pattern formations.
Swing Trading
Swing traders look to buy or sell when prices are trading at an extreme (e.g. the upper band of a channel, or are overbought or oversold). Swing trading strategies work on the principle of Mean Reversion, or regression to the mean. In other words, if the market is overvalued or undervalued, it should return to a more realistic price in the near future.
Swing trading strategies tend to employ indicators like RSI, the Stochastic oscillator and Bollinger Bands.
Define Exit Rules
In order to know when to exit your trade, you need clear exit rules. You must determine exactly how each trade will be managed, to ensure you know what to do when in any trading situation. Additionally, exit rules and logic must be clearly defined if you are interested in turning your system into an Expert Advisor.
The most important factors to consider are:
Stop Losses
Your stop loss is an extremely important factor when creating a trading system. Defining a stop loss is potentially the hardest part of creating a trading system, but some ideas to experiment with are:
Using a fixed number of pips for every trade
Using a static stop loss is the most commonly used method, but is probably not the most effective, since the range of the market differs from day to day, and has no bearing on the actual market conditions. Nevertheless, it is possible to develop systems using this method that are profitable in the long run.
Using a recent higher/lower candle
This method is quite simple – just use the body of a candle that is higher (when going short) or lower (when going long) as the stop loss level. You can further elaborate on this by selecting the highest/lowest level from, for example, the last five bars. This method provides a dynamic stop loss for your system.
Average True Range (ATR)
The Average True Range is the number of pips in a range – defined by the last x number of bars. So, for example, if the average price variance from the high to the low in the last 30 bars was 50 pips, using ATR as a stop loss would mean a 50 pip stop loss for this trade.
If a market becomes more volatile, and the range increases, then the stop loss would be larger. Conversely, in a ranging market the movement and volatility would be lower, meaning a smaller stop loss.
You can also specify a percentage of the ATR to be used as well – for example, 50% of ATR.
Other Methods
Other methods for calculating a stop loss rule might include using pivots, Fibonacci levels, Moving Averages or support and resistance levels, although the latter is more difficult to implement because you would need a support and resistance indicator, and drawing support and resistance levels can be somewhat subjective.
Managing Winning Trades
Once your trade enters profitability, there are several factors you need to consider for your system. Let’s look at these now.
Take Profit Levels
Establishing a take profit level is normally quite an easy calculation. Unless there is a very specific reason to do so, your take profit level should ideally not have less than a 1:1 risk reward ratio. Ideally, a 1:2 or better would give your trades a better risk reward ratio. Even if this means fewer winning trades overall, your system will likely show a positive expectancy. If your trades have less than a 1:1 risk:reward, it means that one losing trade can wipe out the profits of two or more trades.
When looking to create a system with a 1:2 risk:reward ratio, for example, if you are using ATR for your stop loss calculation, you could create a rule that your take profit level will always be double that of your stop loss. This means you have a dynamic stop loss and take profit that reflects the current range of the market, and potentially market conditions as well.
Breakeven & Trailing Stops
You may wish to also incorporate a mechanism whereby you eliminate risk as quickly as possible by moving your stop loss to breakeven based on a predetermined value or level. Just bear in mind that doing so may decrease the risk:reward ratio of your system, as price may reverse to the new level and take you out of your position, leaving you with no profit. Some traders will try and take a few pips of profit instead of moving to just a breakeven position to cover the spread and any commission.
Using a breakeven in this way is the same as using a trailing stop, you are just applying a trailing stop as an initial measure to eliminate risk. You can also use any number of different trailing stop strategies, for example, three bar trailing stop, ATR based trailing stop, trailing along Fibonacci pivot points, trailing to risk:reward levels and many more.
You may even consider beginning a trailing stop at the point where your take profit level might otherwise be. This may further extend your profits beyond what you would otherwise expect from your system.
Whatever method you use, a trailing stop is a valuable tool when implemented properly – there is nothing more demoralizing than seeing a winning trade reverse within a few points of the profit target and turn into a loser!
Partial Closes
Some traders implement a partial closing of their position at certain points of the trade. Traders tend to do this for psychological reasons, but a trader who does this who has a winning system will almost certainly not make as much money as a trader using the same system, who let’s their position run with 100% of the trade capital
For example:
Trader A – 100 pips profit at £2.50 per pip = £250 profit
Trader B – 100 pips profit: £1.25 close at 50 pips + £1.25 at 100 pips = £187.5 profit
If you utilize a breakeven mechanism and/or a trailing stop, you shouldn’t ever need to utilize a partial close.
Risk Management
Risk Management is critical to surviving in the markets. Most professional traders risk 0.5% – 2% of their trading capital per trade, depending on the overall amount of money they have to trade with, and their risk appetite. There are many factors for this – margin requirements, the amount of capital in the trade account and in the case of an account with, for example, one million pounds in it, the psychological effect of losing £20,000 risking 2% per trade may be too much for some people to deal with.
Remember that whether you use a static or dynamic stop loss, the calculation for deciding the risk amount is always the same. The size of the stop loss in pips/points is irrelevant, and the risk percentage should always be the most important factor.
This is because by using a percentage of your account balance/total trading capital, your position size will always be dynamic – this allows profits to compound and automatically reduces your position size if you have a sequence of losing trades.
Trading Plan
It is important to have a trading plan, regardless of whether you intend to trade your system manually or via an Expert Advisor.
The number one rule of your trading plan is to always stick to the rules of your trading system. It is very tempting to break the rules, revenge trade after losing, get bored and “do some scalping” and generally show a lack of discipline when trading. No matter how good your system is, if you cannot control your emotions and your behaviour in general then you will almost certainly lose money.
A trading plan may also cover aspects such as only trading x hours per day, the times of day you trade, not trading NFP day, not trading between the 15th of December and the 15th of January due to lower liquidity, closing positions before weekends to avoid issues with gaps, and other factors.
If you perform backtests, you may well learn after analyzing the results that there are days or times of day/year when it is not advisable to trade your system at all. We will cover this analysis in a future chapter in this course.
Many traders also keep a trade diary to keep themselves honest and accountable – this often entails writing down the times they broke their rules, what they were thinking/feeling at the time and how they plan on not making the same mistakes in future.
Evaluate Your System – Visual Backtesting
Once you have established your entry rules, it is worth spending time performing visual backtests. This allows you to quickly see whether your system is likely to be profitable or not.
If you have already been trading a system and understand it and are happy with it, then this step may be unnecessary, but if you are creating a new system or modifying an existing one, it will save you time and money later, and is a worthwhile exercise to run on several markets to see which ones it might work best with.
Performing a visual backtest will give you an idea of whether or not a system will be profitable or not, and you may decide a system is not worthwhile by performing this exercise.
It is important to fully understand the indicators you are using before doing this, because some indicators are deceptive – either because you haven’t fully understood them or because of malicious intent by the developer. Let’s look at some examples now:
Close of Bar Indicators
As we have seen in a previous lesson, most indicators lag, and one reason for this is that the majority of indicators only give signals at the close of a bar.
The advantage of this is that the signal is “valid” – if a signal was given during an open bar, price might reverse and your trade would lose. The disadvantage of this is that you may have already missed a good amount of a move by the time the bar closes.
It’s important to understand exactly how the indicators you are using work and to not be fooled during a visual backtest.
Repainting Indicators
Repainting indicators are indicators that either appear several bars late or redraw themselves to make the visual backtest look like the perfect system.
For the former, the Fractals indicator that is built into MT4 is an example. This isn’t trying to be deceptive – the purpose of the Fractals indicator is to provide a visual guide to the structure of the market and to make it easy to see where you may wish to draw support and resistance levels. Fractals always print after six new bars, meaning they are unsuitable for entries.
For the latter, many unscrupulous developers create indicators that look amazing – in the hope of people buying their products. These indicators pick perfect tops and bottoms in a visual backtest, but of course are completely useless in live trading.
Making Visual Backtesting Easier
Visual backtesting can be straining on the eyes, and tiring. If you are using more than one indicator in your system, it may be advisable to code/pay a developer to incorporate them all to only show signals for when they all align. This is usually done in the form of buy/sell arrows on the chart.
Let’s take a look at an example.
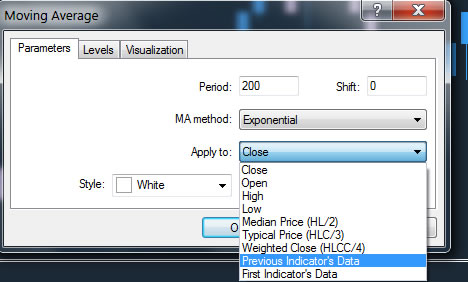
Let’s say we wanted to take the built-in indicator “Demarker” in the “Oscillators section” of the Navigator in MT4. Now, we want to apply a 200 moving average to the Demarker. We can do this by selecting Apply to: Previous Indicator Data:
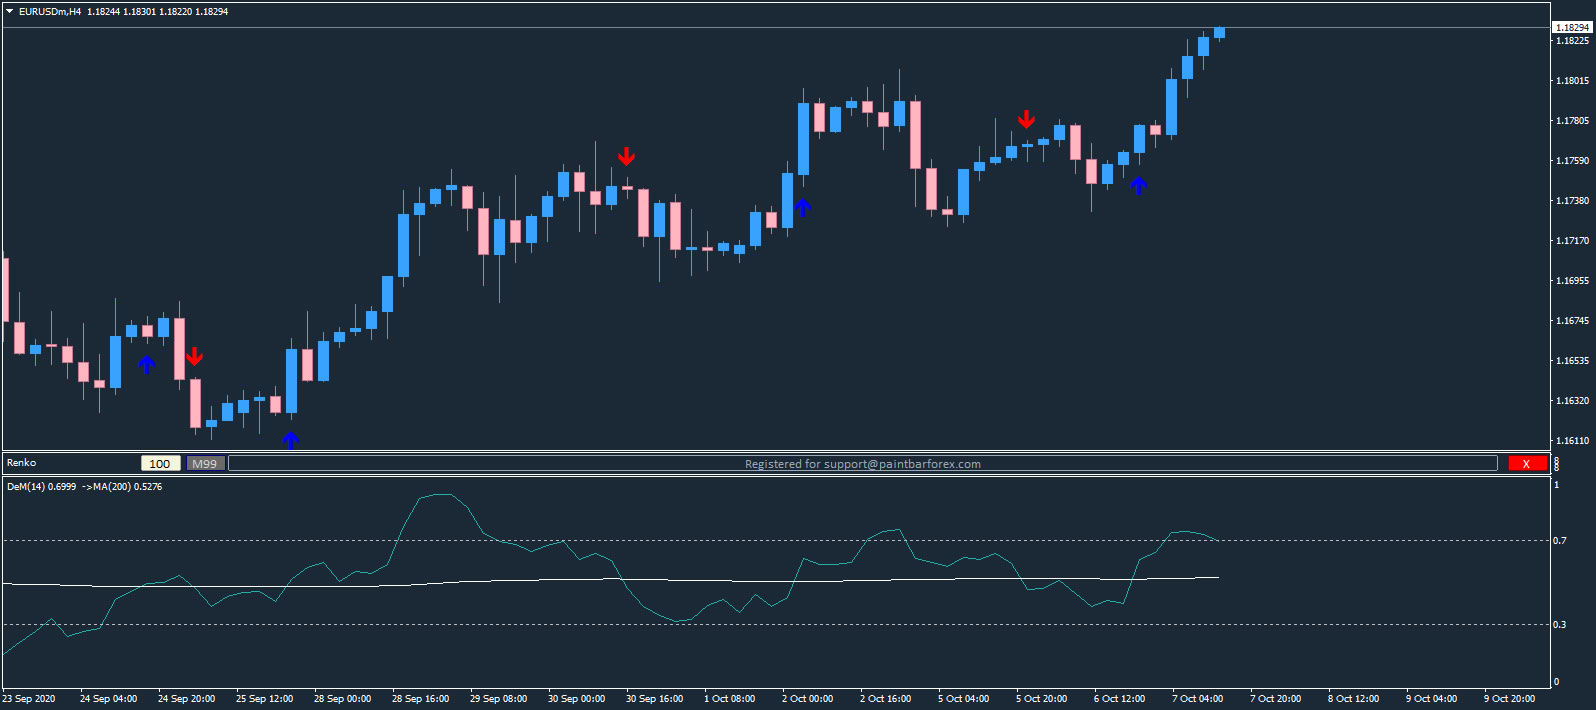
Our custom indicator with buy/sell signal arrows makes the crosses of the Demarker and Moving Average much easier to see:
Having such an indicator makes it easier to check signals against an Expert Advisor later, and if you program the signal arrows to be buffers, then this makes it easy to make into an EA, since the buffers can be utilized as the signals to buy and sell. MQ4 code in this instance might look something like this:
SetIndexStyle(0,DRAW_ARROW);
SetIndexArrow(0,234);
SetIndexBuffer(0,Dn);
SetIndexEmptyValue(0,0.0);
SetIndexLabel(0, “Down”);
SetIndexStyle(1,DRAW_ARROW);
SetIndexArrow(1,233);
SetIndexBuffer(1,Up);
SetIndexEmptyValue(1,0.0);
SetIndexLabel(1, “Up”);
In this example, the 0 Buffer would generate sell signals in an EA, whereas the 1 Buffer would generate buy signals.
Many traders skip this element of the system design implementation, and move straight to making an EA. However, since technical analysis is extremely visual, this is not the most helpful step. You may be able to improve the system by seeing how it operates “at a glance” and as stated, having an indicator version will certainly assist you in testing any EA you develop, both in backtesting and forward (demo/live) testing.
You can perform visual backtests by scrolling backwards in time on your charts, or alternatively you can run indicators in the MT4 backtester. We will cover this in a later lesson in this course.
If you don’t wish to develop an EA and want to trade manually, having the signals incorporated into these signal arrows will enable you to see your entries clearly, and without interpretation and will also enable you to program alerts (audible/email/SMS, etc) when they form).