
Intermarket Correlation
In this lesson we will examine:
– Correlations and how they can assist your trading
– Markets that correlate with each other
– Why commodity prices can influence currencies
Financial markets are connected in many ways. For example, if the price of bonds changes significantly, this can influence the price of currencies and stocks.
Additionally, there are some instruments that historically move in tandem. The Canadian Dollar is a good example. The “Loonie” as the CAD/USD currency pair is sometimes called by traders, is strongly correlated with oil, as oil prices have a significant impact on the Canadian economy.
We will examine correlations and how they can supplement your trading strategy in this lesson.
Measuring Correlation
Correlations occur when prices move closely together. They can be used for currencies, commodities, stocks and indices.
They can also be used to measure how broader markets move in relation to each other.
A good tool for viewing correlations against other assets can be found on the MyFXBook website:

This allows you to view correlations between Forex pairs, commodities, indices (including the VIX) and even cryptocurrencies.
You can also customise the display to only show the symbols in the columns and rows that you are interested in viewing correlations for, as well as the time frame for the correlations (e.g. hourly, daily, weekly, etc).
You can access this tool on the MyFXBook website
(Please note, we are not responsible for third-party content)
The charts that now follow in this lesson were created using a public domain indicator for MT4.
You can download the OverlayChart indicator by clicking here
And you can download the template for this by clicking here
Install the indicator and template in MT4 by following these steps:
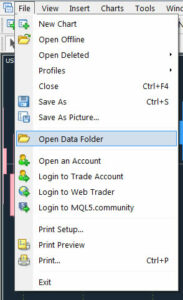
Select “File” from the top menu and then click “Open Data Folder”:
Now, copy the template file (chart-overlay.tpl) into the “templates” folder:
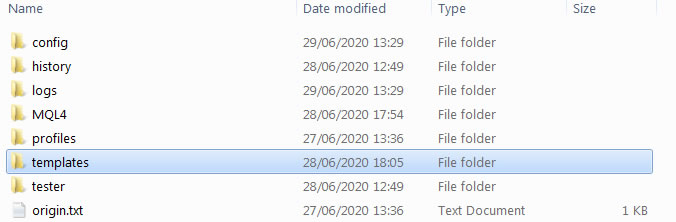
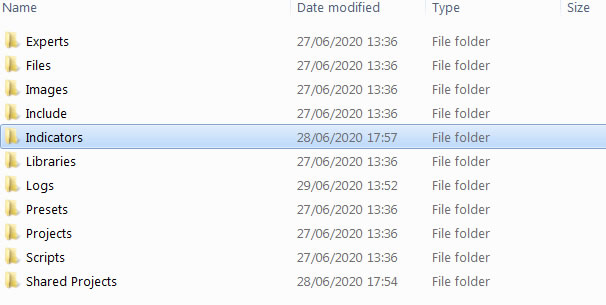
Now double click on the “MQL4” folder and copy the indicator (OverLayChart.mq4) into the “Indicators” folder:
You can now either restart MT4 to install the new files, or alternatively, hold the “Ctrl” key on your keyboard and press the “N” key. This will bring up the Navigator, which shows all the installed indicators, EAs and scripts on your MT4 platform.
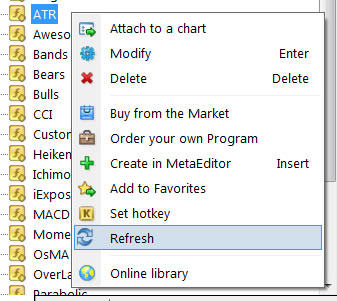
Right click on any indicator with your mouse , then select “Refresh”:
You can now select the indicator from the Navigator:
The parameters for the indicator are as follows:
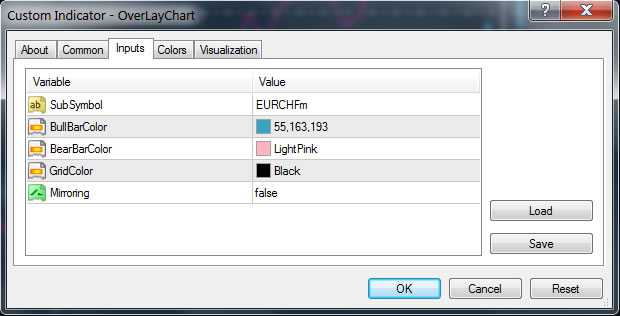
SubSymbol: Type in the instrument you want to compare to see the correlation. This must match the symbol name in Market Watch exactly.
BullBar and BearBar Color: You can define the colours of the charts here.
GridColor: This displays a price axis grid on the new chart, and you can change the colour of it here.
Mirroring: If we want to compare the EUR/USD and the EUR/CHF, since the Euro is the base pair, mirroring would be switched off (set to “false”). If we want to compare WTI Crude Oil (priced in US Dollars) with the Canadian Dollar on the USD/CAD pair, then we would want to use mirroring (set to “true”) if overlaying on a US Oil chart, since CAD is the counter currency in this case.
Correlation Examples
We will now take a look at examples of correlation, and how they might help your trading.
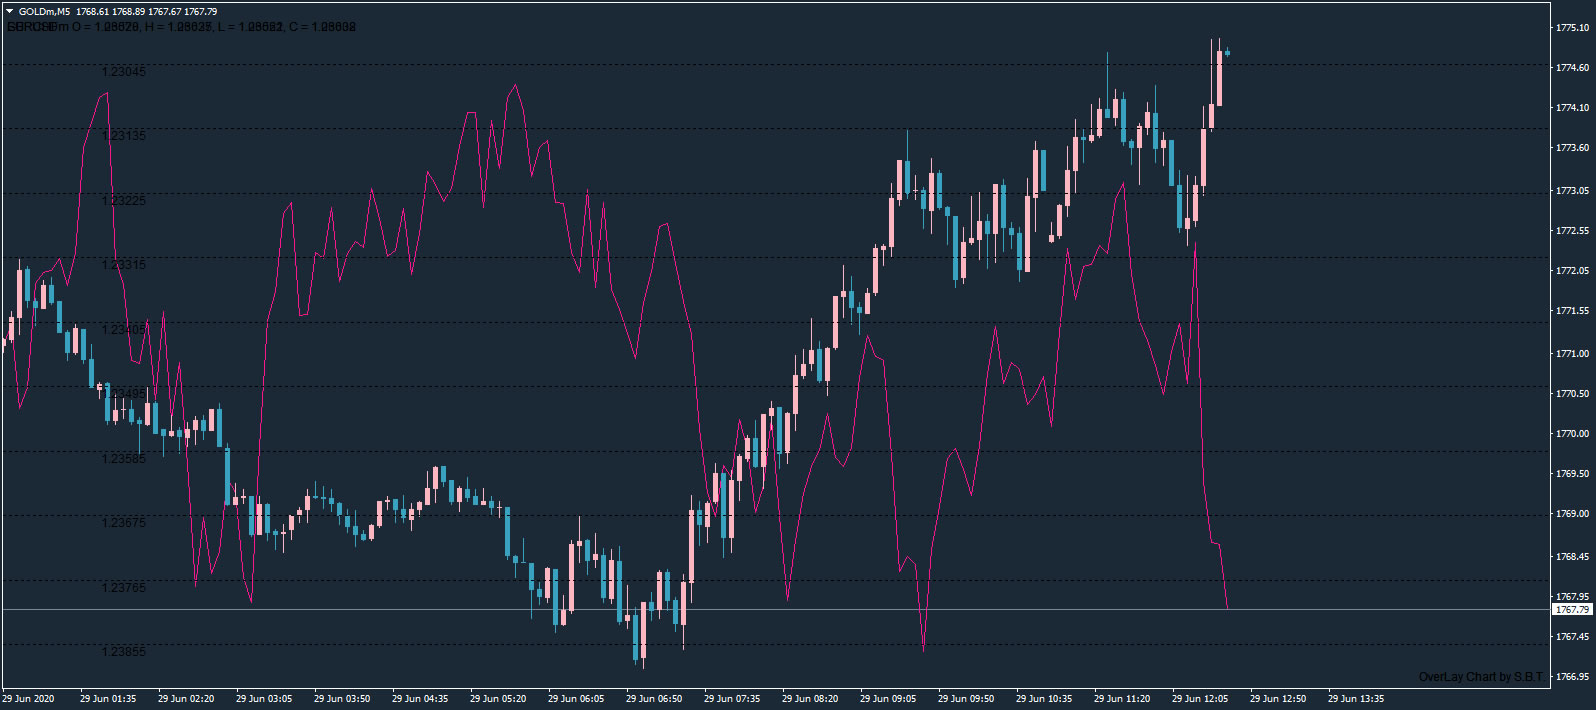
The Canadian Dollar & Oil
As you can see, there’s quite a nice correlation between the Canadian Dollar and US WTI Oil. The line chart is the price of oil, whereas the bar chart is the price movement of the Canadian Dollar.

This is defined as a positive correlation, because both the markets are moving in tandem – in other words, when one market increases, the other market increases as well. When the price of one decreases, so does the other.
This does not happen all the time, but it is useful to bear in mind for several reason as we will examine in a moment.
The US Dollar & Gold
A strong inverse correlation can often be observed between the US Dollar and Gold:
An inverse correlation, also known as a negative correlation, is a contrary relationship between two markets. So when one market increases in value, the other often decreases.
This can occur for two reasons:
A falling Dollar can increase the value of other currencies. This often increases the demand for commodities, including gold.
When the Dollar starts to lose its value, traders look for alternative sources to store value. This may have an effect on the US currency and also US stock markets, which may panic investors and see capital flight to safe havens such as gold.
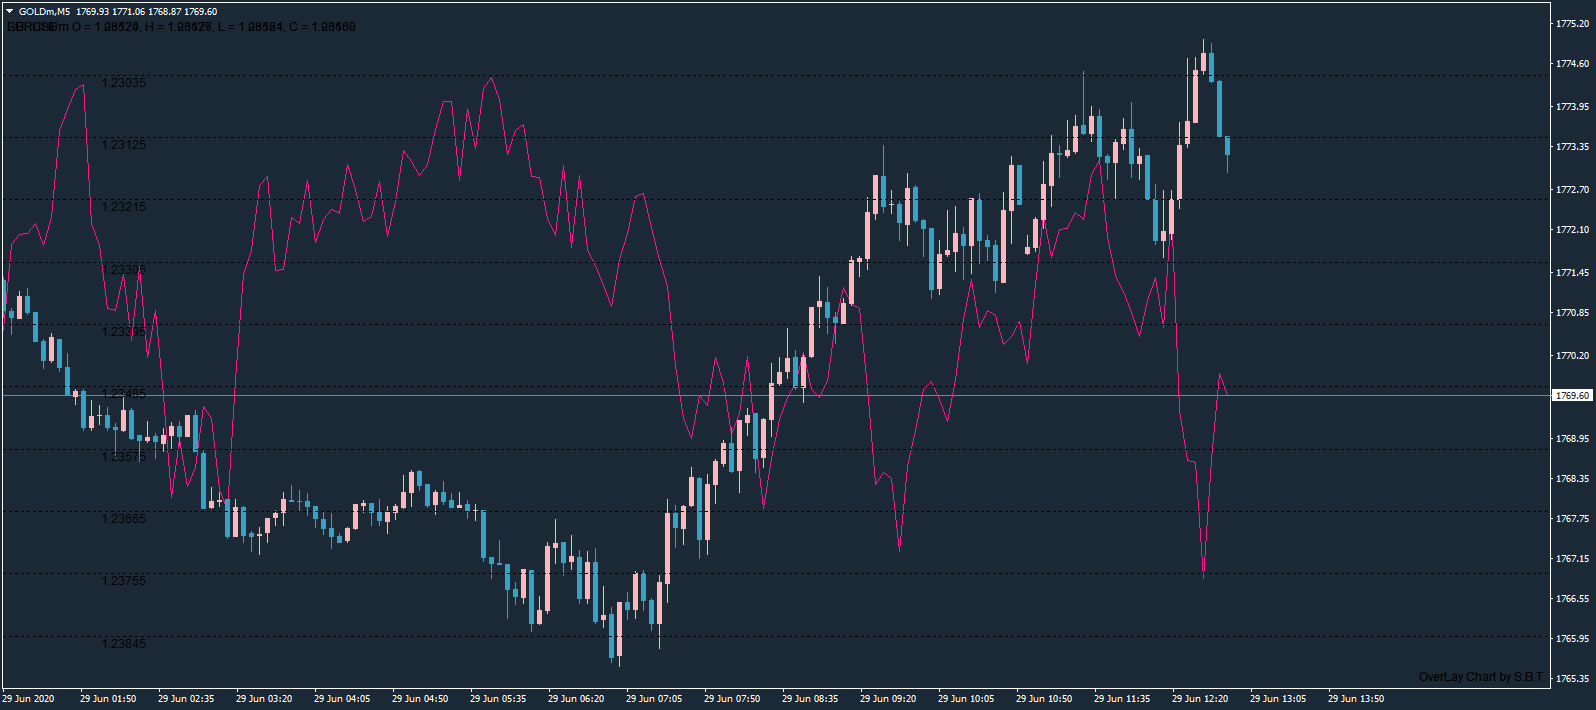
EUR/USD & EUR/CHF
The chart shows the EUR/USD and EUR/CHF (Swiss France). As you can see, it is highly positively correlated:
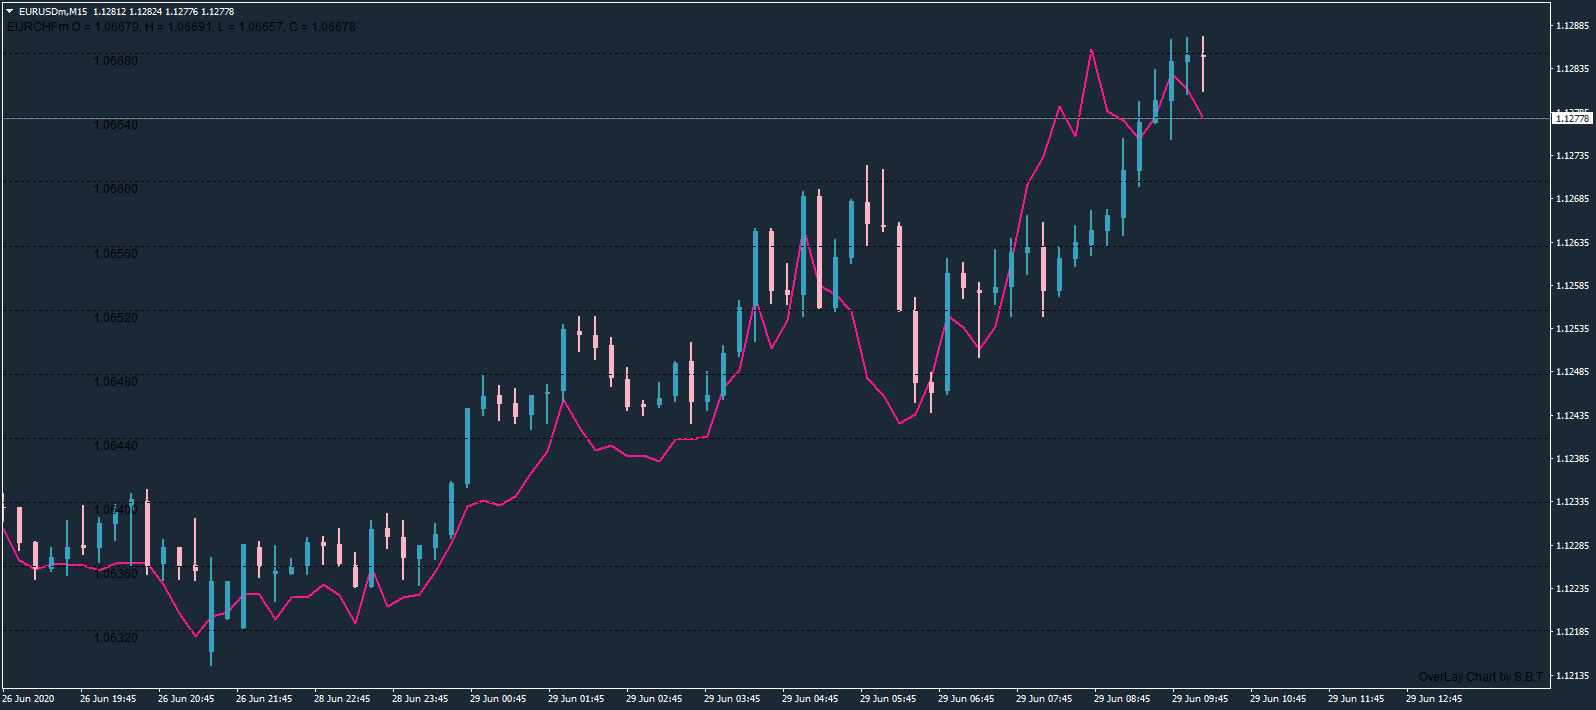
It is important to bear this in mind, since a trade on the EURUSD in the same direction as another trade on the EURCHF will often-times amount to the same thing.
This means you are taking undue risk because you are effectively doubling the risk percentage of your trade.
Assuming you risked 1.5% of your trading account on trades in the same direction on both of these instruments, if both trades went against you, you would have lost 3% of your account balance instead of 1.5%.
It pays to be aware of correlations as part of your risk management.
Divergence
Divergence between two instruments could be used as a form of technical analysis to open a trade. Divergence occurs when prices move opposite to each other.
Instruments that show negative correlation are likely to converge at some point in the future.
Looking at this USD and Gold chart again, you can see how the price diverges from the two instruments, before converging again at various points:
However, there is no guarantee that the markets will not separate for extended periods of time – your stop loss may be triggered well before the markets reverse and converge again.
Final Thoughts
Intermarket correlation is an important part of fundamental analysis, and can even be used as a part of technical analysis as well.
It can also save you from effectively taking the same trade twice.
It is worth spending some time analyzing correlation. You may even discover some new ways of trading the market that can help give your trading system an edge.